Consumer spending behaviors are continuing to shift in 2025, with more consumers seeking flexible payment options to better manage cash flow amid rising costs and economic uncertainty. Buy Now, Pay La...
As we reach the end of a stellar Q1 earnings season, the US equity markets continue to trend sideways in search of the spark that will reignite the “animal spirits.” More than 400 of the S&P 500 constituents have reported Q1 results thus far, with 75% delivering upside surprises on the top line and 81.5% beating on the bottom line. On a sector level, all 11 are on track to beat Q1 EPS forecasts, with 9 of them topping revenue estimates. The S&P 500 is on pace for nearly 24% year over year EPS growth in Q1, well above expectations of 16.5% and the best year over year increase since Q4 2010. Perhaps the best story to come out of the current earnings season is the better-than-expected revenue growth, currently on track for a year over year gain of 6.1% and well above the 2011-2017 average of 3.8%. The last point is significant, as it can’t be written off as a benefit from tax reform or stock buybacks.
So how well have investors been rewarded during this earnings season? If you had bought an S&P 500 index fund on March 7, when Costco reported 10.85% revenue growth and 21.49% EPS growth to start things off, you would have earned a return of -2% as of today's close. The market appears to be warming up to the idea that this may be as good as it gets for corporate operating performance, and that Q1 2018’s lofty numbers will become 2019’s lofty hurdles. Sometimes investors need a reminder that markets are discounting mechanisms, and that while spiking the football after a long touchdown run is exciting, markets are focused on the next drive.
The top-line of the income statement tends to provide the first clue that a company’s growth is cooling, and the market has become increasingly weary of companies that manufacture an EPS beat but fail to deliver on revenues. During this earnings season, the average one-day excess return for S&P 500 companies falling short of revenue expectations has continued to widen, as stocks of those that miss have dropped 1.5% on average in the day after reporting, compared to a 0.3% gain for those that beat. Stocks that have beaten both the top and bottom line estimates have increased 0.7% on average following earnings, while those that missed on revenues and EPS have fallen 2.8% the day after reporting.
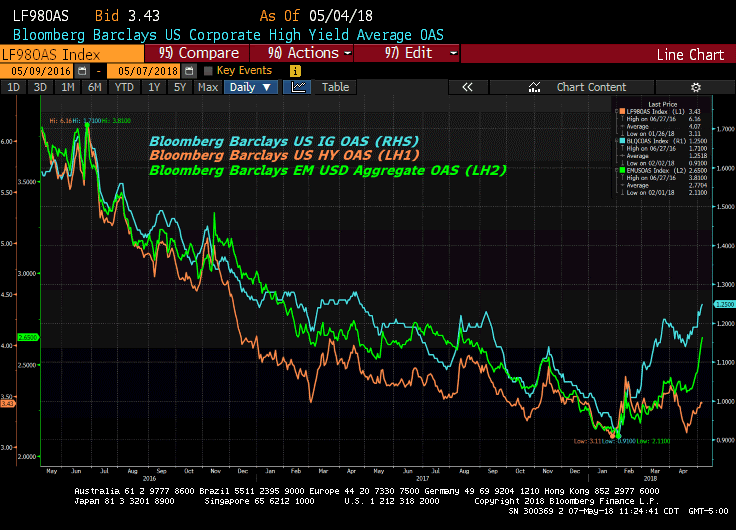
The current macro environment presents several clear obstacles for the equity markets. Short term borrowing costs are going up across the board as the Fed continues to normalize US rates and shrink their balance sheet. The 3 month London Interbank Overnight Rate (LIBOR) has doubled over the last 12 months, from 1.17% on 5/18/17 to 2.369% as of today. The Prime Rate has increased by 75 bps over the last year, with 2-3 rate hikes on the horizon by years end. Corporate investment grade credit spreads appear to have reversed and have been trending higher since early February (see chart below), although we are still well below levels that suggest a deterioration of the credit markets, especially given the relative performance of high yield credit spreads. Nevertheless, it is still worth keeping an eye. Capital is becoming more expensive, so multiples are going to compress as this is priced into market valuations.

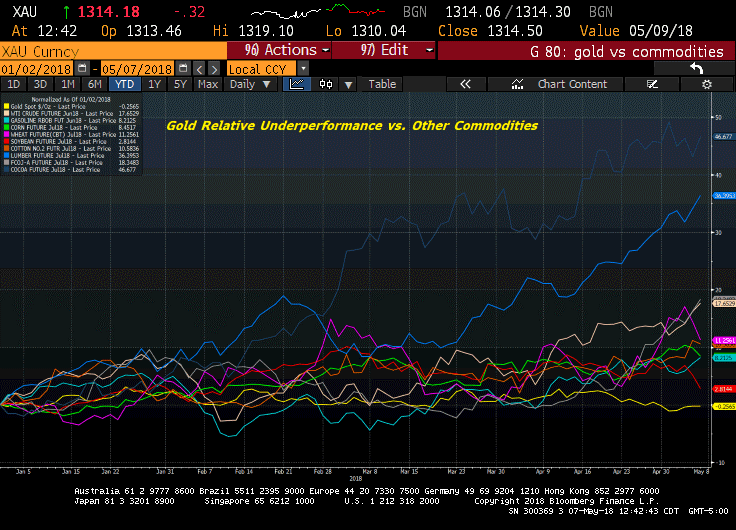
Capital is not the only thing becoming more expensive, input costs are on the rise as well. Everything from crude to cocoa has been moving higher. The chart below shows the cost of several widely used commodities that impact industries ranging from homebuilders to apparel manufacturers. Many of these commodities have continued to surge despite a strengthening USD, which has appreciated by over 4.5% relative to a basket of developed market currencies. The impact of this will invariably begin to show up in earnings if companies are unable to pass these expenses along in the form of higher prices. Hershey Co. has fallen 19.25% year to date.

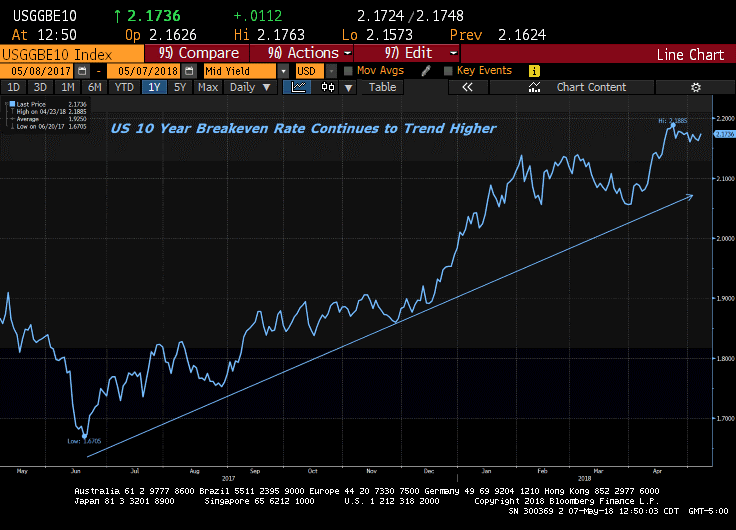
Inflation is on the rise, whether you want to believe it or not. The US 10 YR Breakeven rate, which measures the additional yield that a nominal bond requires over inflation linked bond, has increased by over 50 bps to 2.174% since last June. The Fed has a difficult task ahead of itself with no real historical point of reference.

I still believe that there is some juice left in this cycle, but do believe that it is important to understand what you own and temper your return expectations. The market provided investors with an “advanced payment, positioning will be the key as the QE experiment winds down.
Related Categories
Capital MarketsJosh Lynch
Josh Lynch assumed the position of Director of Portfolio Management of SWBC Investment Services, LLC in 2014. He is responsible for managing all of the firm’s proprietary portfolios. He began his career in risk management with a Fortune 500 company. After 11 years, Josh transitioned to financial services joining Merrill Lynch in 2009. He joined SWBC Investment Services in 2011 as an Investment Associate, where his focus was on portfolio strategy and analysis. He also partnered with the Wealth Management team in providing customized portfolio solutions to corporations, defined benefits plans, non-profit organizations, and high net worth individuals. Josh is a graduate of Florida State University with a Bachelor of Arts in History and Economics. He earned the Chartered Financial Analyst (CFA®) designation and holds FINRA Series 7 and 66 licenses.


Let Us Know What You Thought about this Post.
Put your Comment Below.