
The financial services industry is continuously evolving, and it is essential to optimize collections strategies to maintain liquidity and minimize risk. One of the most critical choices for credit un...
Capital Markets
|
4 min read
Yesterday marked the 30-year anniversary of “Black Monday,” a day when the Dow Jones Industrial Average (DJIA) fell 508 points in a single trading session, representing a market cap loss of nearly 22%. Even more fascinating than the speed and size of the decline, was that there were no major announcements released over the preceding weekend, leaving investors struggling to make sense of the sell-off. Panic selling started overnight in Asia, and this created a domino effect that moved westward, eventually slamming the U.S. markets. The use of “Portfolio Insurance,” which is a form of dynamic hedging used by institutions to limit losses in falling markets by selling futures contracts, absorbed most of the blame, as the computerized trading systems that administered these hedging programs perpetuated a negative feedback loop. By the end of the month, most exchanges around the globe had dropped by more than 20%. Several protective safeguards were built into the exchanges following this event, such as trading curbs and circuit breakers.
Over the history of the markets, October has always been a month where we see a pickup in market volatility, and some cases complete blowout, like 2008 when the CBOE Volatility Index (VIX) jumped from 39 to 90.Even when market volatility finishes the month near the lows, the range throughout October has normally been wide.
Since 2009, the average range (spread between high and low) for the VIX in October is 11.36 points, with the high over that period occurring in 2011 (22.44 points). With only 7 trading days remaining this month, the VIX has traded in a narrow range 2.66 points and sits at the lowest levels in over a decade (9.86).
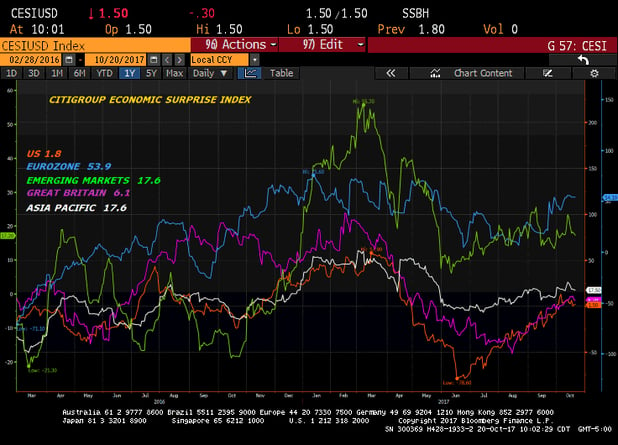
Unlike October 1987, where there were no real catalysts to explain the sell-off, we are hit daily with a non-stop flow of headlines, geopolitical threats, and tweets. In my piece from January, I wrote that “a degree of fatigue will set in as we move forward, unless the rhetoric is backed up by action,” and it does appear that the markets have built up an immunity to the constant barrage of tweets, fake news, and political hacks. Nothing has really gotten done, and attention has drifted the global economic environment, which looks pretty good. The chart below illustrates that worldwide, the Citigroup Economic Surprise Indexes are currently in positive territory and trending up, led by the Eurozone. This index measures economic data relative to consensus expectations, showing that on balance, the data is coming in stronger. Global GDP is expected to accelerate to 3.5% in 2017, the first year over year increase since 2014, and continue to build in 2018 to 3.6%-3.8%. Credit conditions remain supportive, as spreads in investment grade and high yield continue to compress, and which bolds well for global equities going forward. While the Fed is expected to begin shrinking their balance sheet, they are planning to do so gradually, so liquidity in the markets should remain high.
 As far as corporate conditions are concerned, I expect another strong earnings season for Q3. About the worst thing that I can say, is that valuations leave very little room for disappointment. Earnings whiffs and lackluster guidance will not go unpunished. With that being, I would rather navigate an expensive market in a good economy, than a cheap market in worsening conditions. The notable improvement in global trade data and reflation sensitive markets suggests that cyclical sectors should be able to broadly meet expectations. Although we are still in the early innings of Q3 earnings season, with only 88 of 500 S&P 500 companies reporting, so far the results look good, as revenues (+6.8%) and earnings (+8.5%) are coming in ahead of expectations.
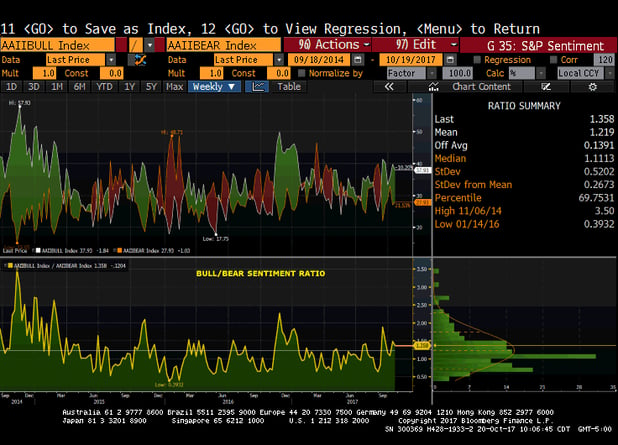
Despite the US indices setting new highs, overall investor sentiment does not appear to be too frothy. In looking at the chart showing the AAII weekly sentiment readings, we see that the ratio of bulls to bears is only slightly above the three year average, and well off levels that we have seen over this period.
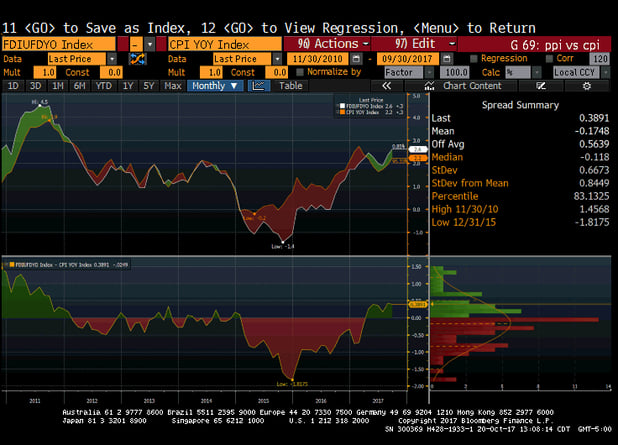
 Last month I wrote about the recovery in commodity prices after years of declines, in particular industrial metals, and this is something that will need to be monitored over the coming months. The latest Producer Price Index Final Demand (PPI) reading for September showed a 2.6% year over year increase, while the Consumer Price Index (CPI) only printed at 2.2% (chart below). If we continue to see input costs exceed consumer prices, it should eventually begin to show up in gross margins. Some of this could be due to storm related shortages, but it is worth keeping an eye on for hints of inflation, as it does appear that the crossover occurred earlier in the year and has persisted.
Member SIPC & FINRA. Advisory services offered through SWBC Investment Company, a Registered Investment Advisor.
Not for redistribution—SWBC may from time to time publish content in this blog and/or on this site that has been created by affiliated or unaffiliated contributors. These contributors may include SWBC employees, other financial advisors, third-party authors who are paid a fee by SWBC, or other parties. The content of such posts does not necessarily represent the actual views or opinions of SWBC or any of its officers, directors, or employees. The opinions expressed by guest bloggers and/or blog interviewees are strictly their own and do not necessarily represent those of SWBC. The information provided on this site is for general information only, and SWBC cannot and does not guarantee the accuracy, validity, timeliness or completeness of any information contained on this site. None of the information on this site, nor any opinion contained in any blog post or other content on this site, constitutes a solicitation or offer by SWBC or its affiliates to buy or sell any securities, futures, options or other financial instruments. Nothing on this site constitutes any investment advice or service. Financial advisory services are provided only to investors who become SWBC clients.


Let Us Know What You Thought about this Post.
Put your Comment Below.