
Housing market fundamentals remain challenging, with affordability continuing to be the industry's primary hurdle as home prices remain elevated relative to household incomes and price-to-income ratio...
Backed Into a Corner: Inflation, Oil, and the Fed's Credibility Test
Interest rates entered last week's holiday-shortened trading week after testing a major resistance level, with the 10-Year U.S. Treasury yield hovering just below 4.82%, the high reached in March 2025. The prior Friday's employment report, which pointed to a healthy economy and resilient labor market, had largely been digested by investors. Attention subsequently shifted toward a more pressing concern: the prospect of persistently elevated inflation.
I would be remiss not to acknowledge last week's observances of the September 11 anniversary. On Thursday evening, I attended an annual gathering with former colleagues who were fortunate to escape the World Trade Center that day. Reconnecting each year is a poignant reminder of life's fragility, the importance of family and friendships, and the enduring obligation to remember those who were lost.
Interest rates entered last week's holiday-shortened trading week after testing a major resistance level, with the 10-Year U.S. Treasury yield hovering just below 4.82%, the high reached in March 2025. The prior Friday's employment report, which pointed to a healthy economy and resilient labor market, had largely been digested by investors. Attention subsequently shifted toward a more pressing concern: the prospect of persistently elevated inflation.
With markets awaiting Thursday's Producer Price Index (PPI) report and Friday's Consumer Price Index (CPI) release, geopolitical developments provided plenty of additional headlines. Houthi attacks on Saudi Arabian refining infrastructure, U.S. strikes on Iranian targets, and reduced traffic through the Strait of Hormuz combined to push energy prices sharply higher. Brent crude oil rose above $100 per barrel by early Wednesday, reigniting inflation concerns.
Treasury markets reacted accordingly, with the 10-Year yield breaking above the important 4.82% resistance level and opening the door to a move toward 5%, with little in the way of technical resistance remaining.
Importantly, expectations for next week's Federal Open Market Committee (FOMC) meeting became increasingly tied to the inflation data. My expectation, which market pricing has thus far supported, is that the Federal Reserve is virtually required to tighten policy even in the face of relatively benign data, let alone evidence of renewed inflationary pressure. In addition, Chair Warsh's repeated emphasis on restoring price stability has increased the likelihood that policymakers will feel compelled to act rather than rely solely on rhetoric.
Thursday's PPI report came in largely as expected and could be characterized as neutral. The data suggested neither a meaningful reacceleration in inflation nor demonstrated significant progress toward disinflation. Nevertheless, oil prices continued their advance, climbing toward $110 per barrel by day's end. Treasury yields followed suit, with the 10-Year reaching approximately 4.96%.
Friday's CPI release was somewhat firmer than expected and suggested that inflation pressures may be edging higher.
Interestingly, Treasury yields retreated modestly following the report but ultimately finished the session little changed, indicating that much of the inflation concern had already been reflected in market pricing.
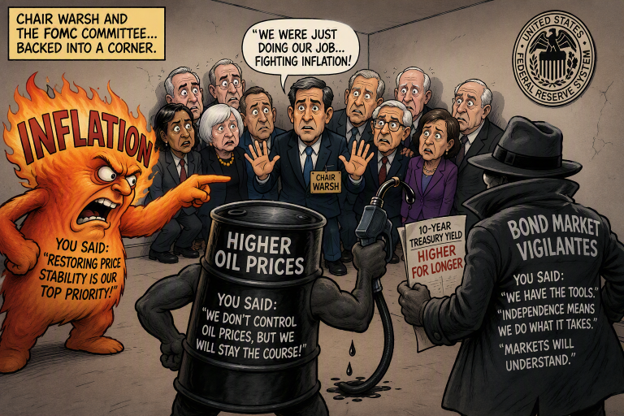
The Federal Reserve increasingly appears to be backed into a corner of its own making. After repeatedly emphasizing its determination to restore price stability and prevent a renewed inflationary cycle, Chair Warsh and the FOMC have left themselves with little room to rely solely on rhetoric.
With oil prices rising, inflation data showing signs of renewed pressure, and market participants closely scrutinizing the Fed's commitment to its mandate, policymakers are virtually compelled to deliver a rate hike at next week's meeting.
Failure to act could invite questions about the consistency between their stated inflation-fighting posture and their willingness to follow through when conditions warrant. In that sense, preserving credibility may now be almost as important as the policy action itself.
Paradoxically, a rate hike could prove constructive for financial markets. In a classic "buy the rumor, sell the fact" scenario, investors may view a policy tightening as evidence that the Fed remains committed to addressing inflation risks. Such an outcome could help stabilize long-term interest rates, which have largely led the Fed rather than followed it over the past several months. A decisive policy move may provide the reassurance bond investors have been seeking that central bankers remain focused on the inflation challenge. This would not solve the issue regarding an elevated term premium for longer-dated Treasuries due to the heavy government debt load
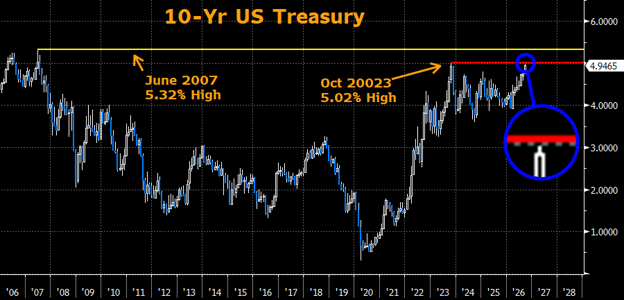
Looking ahead, I continue to expect the October 2023 intraday high of approximately 5.02% on the 10-Year Treasury to be tested.
There remains a reasonable probability that yields ultimately move higher still before a durable reversal occurs. The last time Treasury yields sustained levels above 5% was in 2007, prior to the Global Financial Crisis, when the 10-Year peaked near 5.32%. While that level is not my base case, it remains a useful reference point for investors should upward pressure on rates persist.
From the Municipal Desk
Contributions from Ryan Riffe
Municipal bonds followed the pressured Treasury market to extend their losses for yet another week. By Thursday's close benchmark yields rose as much as 24 basis points in certain parts of the curve. The front-end, which has lately provided as a place of refuge, was also unable to avoid weakness as rates rose roughly 20 basis points for one and two year maturities. The market has come a long way in a short period of time. After hitting a year-to-date low of 2.52% in late February, the 10-year benchmark yield has steadily climbed to 3.70%. Over this same stretch, the market has witnessed significant curve flattening with the 10-30yr spread compressing 43 basis points.
An inline CPI print Friday staved off further bloodshed as 10-30yr Treasuries seemed to applaud what looks to be an inevitable fed hike next week. Although we are certainly not out of the woods, there does look to be some glimmer of hope for municipals as supply significantly drops from $17+ billion to $9.5 billion. In addition, 10 and 30yr ratios have hit their most attractive levels in a year (75% and 92%), which may allow investors to tip their toes back into muni waters.
Muni-Ratios

An index is unmanaged and not available for direct investment. Definitions sourced from Bloomberg.
The Bloomberg Barclays Global Aggregate Negative Yielding Debt Market Value Index represents the portion of the Bloomberg Barclays Global Aggregate Index that measures the aggregate value of global debt with a negative yield. • The S&P 500® is widely regarded as the best single gauge of large-cap U.S. equities and serves as the foundation for a wide range of investment products. The index includes 500 leading companies and captures approximately 80% coverage of available market capitalization. • The NASDAQ Composite Index is a broad-based capitalization-weighted index of stocks in all three NASDAQ tiers: Global Select, Global Market and Capital Market. The index was developed with a base level of 100 as of February 5, 1971.• The Cboe Volatility Index® (VIX) is a calculation designed to produce a measure of constant, 30-day expected volatility of the US stock market, derived from real-time, mid-quote prices of weekly S&P 500® Index (SPX) call and put options with a range of 23 to 37 days to expiration.• The ICE BofA MOVE Index is a yield curve weighted index of the normalized implied volatility on 1-month Treasury options. It is the weighted average of implied volatilities on the CT2 (Current 2 Year Government Note), CT5 (Current 5 Year Government Note), CT10 (Current 10 Year Government Note), and CT30 (Current 30 Year Government Note), with weights 0.2/0.2/0.4/0.2 respectively.• The Markit CDX North America Investment Grade Index is composed of 125 equally weighted credit default swaps on investment grade entities, distributed among 6 sub-indices: High Volatility, Consumer, Energy, Financial, Industrial, and Technology, Media & Tele-communications. Markit CDX indices roll every 6 months in March & September. • The Markit CDX North America High Yield Index is composed of 100 non-investment grade entities, distributed among 2 sub-indices: B, BB. All entities are domiciled in North America. Markit CDX indices roll every 6 months in March & September. • The U.S. Dollar Index (USDX) indicates the general international value of the USD. The USDX does this by averaging the exchange rates between the USD and major world currencies. Intercontinental Exchange (ICE) US computes this by using the rates supplied by some 500 banks.
Investing involves certain risks, including possible loss of principal. You should understand and carefully consider a strategy’s objectives, risks, fees, expenses, and other information before investing. The views expressed in this commentary are subject to change and are not intended to be a recommendation or investment advice. Such views do not take into account the individual financial circumstances or objectives of any investor that receives them. All indices are unmanaged and are not available for direct investment. Indices do not incur costs including the payment of transaction costs, fees, and other expenses. This information should not be considered a solicitation or an offer to provide any service in any jurisdiction where it would be unlawful to do so under the laws of that jurisdiction. Past performance is no guarantee of future results.
© 2025 SWBC. All rights reserved. Securities offered through SWBC Investment Services, LLC, a registered broker/dealer. Member FINRA & SIPC. Advisory services offered through SWBC Investment Company, a Registered Investment Advisor, registered as such with the US Securities & Exchange Commission. SWBC Investment Services, LLC is under separate ownership from any other named entity. SWBC Investment Services, LLC a division of SWBC, is a nationwide partnership of advisor.

Let Us Know What You Thought about this Post.
Put your Comment Below.