
Housing market fundamentals remain challenging, with affordability continuing to be the industry's primary hurdle as home prices remain elevated relative to household incomes and price-to-income ratio...
A Hawkish Reset at Jackson Hole: 2% Means 2%
Markets entered Friday focused squarely on Chair Warsh's inaugural Jackson Hole address, though several developments shaped trading ahead of the highly anticipated speech.
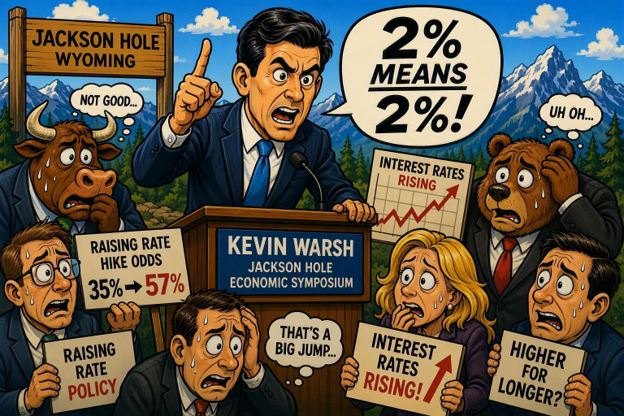 Early in the week, investors continued to shrug off Treasury Secretary Bessent's announcement of increased Treasury buybacks targeting off-the-run long-dated securities beginning September 9. Meanwhile, reports that U.S. diplomats could soon return to embassies throughout the Middle East supported the rates market on hopes of progress toward regional peace initiatives. Interestingly, the energy market remained unconvinced. Brent crude continued to trade above $85 per barrel, suggesting oil traders remain skeptical that geopolitical risks are meaningfully subsiding.
The narrative shifted on Wednesday when the Fed's preferred inflation measure, Personal Consumption Expenditures (PCE), failed to provide evidence of further disinflation.
Headline PCE remained at 3.7% while core PCE held at 3.3%, reinforcing concerns that inflation progress has stalled. Treasury yields quickly retraced their earlier declines. At the same time, the second estimate of second-quarter GDP was unchanged at 1.5%, confirming an economy that continues to expand at a moderate but resilient pace.
Heading into Friday's speech, market expectations were sharply divided. Some investors anticipated an unmistakably hawkish message, while others expected Warsh to begin laying the foundation for an eventual easing cycle. The opening portion of the speech appeared somewhat tentative and offered little indication of policy direction. That ambiguity quickly disappeared.
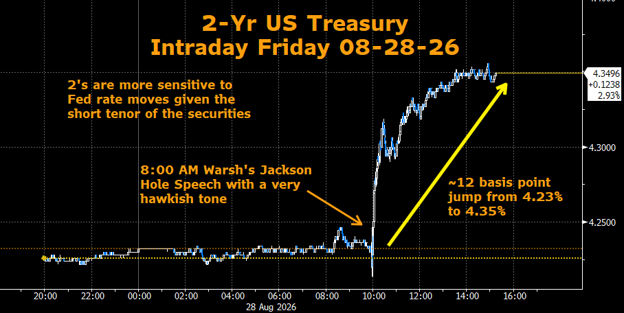 Warsh ultimately delivered one of the most hawkish messages markets have heard from the Fed in recent years. He emphasized that inflation remains well above target, recent data have not demonstrated sufficient progress toward the Federal Reserve's 2% objective, and financial conditions do not appear restrictive enough to guarantee success. Most importantly, he left little room for interpretation regarding the Fed's inflation target.
Warsh repeatedly stressed that returning inflation to 2% remains the central bank's objective, describing it as the Fed's "mandate," its "charge to keep," and plainly stating that policymakers still have "work to do."
Absent traditional forward guidance, the message was nevertheless clear. The Fed appears increasingly prepared to tighten policy further if inflation fails to demonstrate convincing progress. Fed Funds futures rapidly adjusted to the speech, with the implied probability of a September rate hike climbing from approximately 35% before the address to more than 57% afterward.
While the rhetoric was undoubtedly forceful, I remain focused on actions rather than words. Investors have endured several years of aggressive inflation-fighting language with limited follow-through. Though Warsh's speech was short on forward guidance, it slightly helped the Fed's credibility, but restoring policy credibility ultimately requires action.
The market response was telling. By Friday's close, the Treasury curve experienced a meaningful bear flattening.
Two-year yields rose from roughly 4.23% to 4.35%, while 10-year yields increased from approximately 4.68% to 4.72%. Thirty-year yields were little changed near 5.20%. The move reflected growing expectations that any near-term Fed tightening would have its greatest impact on the front end of the curve, while longer maturities found modest support from confidence that the Fed may finally be willing to make difficult decisions to combat inflation.
Looking ahead, I now expect the Federal Reserve to begin another phase of policy tightening at the September meeting, with at least one additional rate hike this year.
The primary risk to that outlook would be a meaningful downside surprise in the August CPI and PPI reports scheduled before the next FOMC meeting. Such data would need to show clear and convincing progress toward the 2% inflation objective.
As a result, I continue to expect higher interest rates across the curve. Specifically, the 10-year Treasury yield appears poised to challenge its January 2025 peak near 4.80% and could ultimately test the psychologically important 5% threshold. Similarly, 30-year Treasury yields may move above 5.50% as investors confront persistent inflation pressures alongside mounting fiscal concerns. With gross federal debt now exceeding $40 trillion, the combination of elevated inflation and deteriorating government finances remains a powerful headwind for long-duration bonds.
From the Municipal Desk
Contributions from Ryan Riffe
With markets anxiously waiting on Warsh and the Fed, municipals continued to struggle to gain momentum. Over the course of the week, the municipal curve bear steepened, with yields in the 15 to 20-year portion of the curve rising by as much as 10 basis points. Although Lipper reported a healthy $1.4 billion of weekly inflows, the market remained under pressure as record levels of new issuance continued to overwhelm an already fatigued investor base.
One bright spot came from the State of California's new issue transaction. Despite rising benchmark Treasury yields and uncertainty surrounding Jackson Hole, strong investor demand allowed the deal to be upsized by $300 million, bringing the total offering to $3.14 billion. The successful execution demonstrated that investor appetite remains intact when presented with attractive structures and sufficient concessions.
Valuations have become increasingly compelling. Ten-year municipal-to-Treasury ratios now sit near 70%, a level that has recently triggered buy signals for many market participants. In addition, absolute yields in the intermediate and long end of the curve have approached or surpassed 5%, pushing taxable-equivalent yields north of 8% for investors in the highest tax brackets. Those are difficult levels for income-oriented investors to ignore.
Looking ahead, the primary calendar is expected to remain heavy, with roughly $15 billion of new issue supply slated to come to market. However, with Jackson Hole now in the rearview mirror and one major source of uncertainty removed, the hope is that attractive relative value, compelling absolute yields, and continued fund inflows will finally be enough to bring sidelined investors back into the market. After months of waiting for better entry points, investors may be running out of excuses.
Muni-Ratios
An index is unmanaged and not available for direct investment. Definitions sourced from Bloomberg.
The Bloomberg Barclays Global Aggregate Negative Yielding Debt Market Value Index represents the portion of the Bloomberg Barclays Global Aggregate Index that measures the aggregate value of global debt with a negative yield. • The S&P 500® is widely regarded as the best single gauge of large-cap U.S. equities and serves as the foundation for a wide range of investment products. The index includes 500 leading companies and captures approximately 80% coverage of available market capitalization. • The NASDAQ Composite Index is a broad-based capitalization-weighted index of stocks in all three NASDAQ tiers: Global Select, Global Market and Capital Market. The index was developed with a base level of 100 as of February 5, 1971.• The Cboe Volatility Index® (VIX) is a calculation designed to produce a measure of constant, 30-day expected volatility of the US stock market, derived from real-time, mid-quote prices of weekly S&P 500® Index (SPX) call and put options with a range of 23 to 37 days to expiration.• The ICE BofA MOVE Index is a yield curve weighted index of the normalized implied volatility on 1-month Treasury options. It is the weighted average of implied volatilities on the CT2 (Current 2 Year Government Note), CT5 (Current 5 Year Government Note), CT10 (Current 10 Year Government Note), and CT30 (Current 30 Year Government Note), with weights 0.2/0.2/0.4/0.2 respectively.• The Markit CDX North America Investment Grade Index is composed of 125 equally weighted credit default swaps on investment grade entities, distributed among 6 sub-indices: High Volatility, Consumer, Energy, Financial, Industrial, and Technology, Media & Tele-communications. Markit CDX indices roll every 6 months in March & September. • The Markit CDX North America High Yield Index is composed of 100 non-investment grade entities, distributed among 2 sub-indices: B, BB. All entities are domiciled in North America. Markit CDX indices roll every 6 months in March & September. • The U.S. Dollar Index (USDX) indicates the general international value of the USD. The USDX does this by averaging the exchange rates between the USD and major world currencies. Intercontinental Exchange (ICE) US computes this by using the rates supplied by some 500 banks.
Investing involves certain risks, including possible loss of principal. You should understand and carefully consider a strategy’s objectives, risks, fees, expenses, and other information before investing. The views expressed in this commentary are subject to change and are not intended to be a recommendation or investment advice. Such views do not take into account the individual financial circumstances or objectives of any investor that receives them. All indices are unmanaged and are not available for direct investment. Indices do not incur costs including the payment of transaction costs, fees, and other expenses. This information should not be considered a solicitation or an offer to provide any service in any jurisdiction where it would be unlawful to do so under the laws of that jurisdiction. Past performance is no guarantee of future results.
© 2025 SWBC. All rights reserved. Securities offered through SWBC Investment Services, LLC, a registered broker/dealer. Member FINRA & SIPC. Advisory services offered through SWBC Investment Company, a Registered Investment Advisor, registered as such with the US Securities & Exchange Commission. SWBC Investment Services, LLC is under separate ownership from any other named entity. SWBC Investment Services, LLC a division of SWBC, is a nationwide partnership of advisor.
Let Us Know What You Thought about this Post.
Put your Comment Below.