
Five-Handle? What Five-Handle? Treasuries Catch a Bid The risk-off tone that emerged the previous week remained firmly in place as investors began questioning whether the extraordinary pace of growth ...
Five-Handle? What Five-Handle? Treasuries Catch a Bid
The risk-off tone that emerged the previous week remained firmly in place as investors began questioning whether the extraordinary pace of growth and spending underpinning the AI trade can be sustained. With relatively little economic data on the calendar and Federal Reserve officials sidelined by the pre-FOMC blackout period, markets were left to navigate on sentiment and headlines alone.
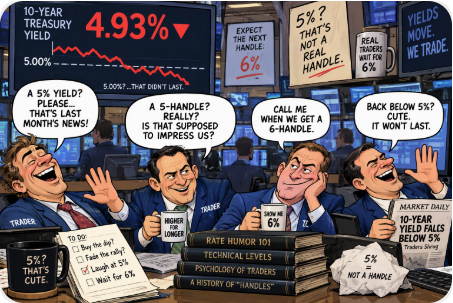
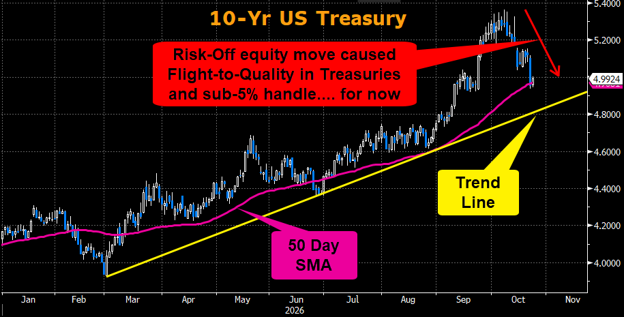
Those headlines continued to come from the Middle East. Ongoing military activity, retaliatory strikes, and renewed disruptions to shipping routes helped push energy prices higher and reinforced concerns about geopolitical risk. As oil climbed, investors sought safety in Treasuries, driving yields sharply lower. The benchmark 10-year yield decisively broke through key technical support levels and, more notably, fell below the psychologically important 5.00% threshold.
While earnings from Meta and Tesla were generally solid, investors appeared more focused on future spending initiatives than the most recent quarterly performance.
More measured language surrounding future capital expenditures raised questions about whether the peak pace of AI-related spending may be approaching. After a historic run fueled by seemingly insatiable demand for AI infrastructure, even a modest shift toward spending discipline was enough to introduce doubt. The question investors are now wrestling with is whether this represents a healthy pause within the AI cycle or the beginning of a broader reassessment of growth expectations.
Meanwhile, Brent crude surged above $117 per barrel, reaching its highest level since May. Renewed attacks in Saudi Arabia and Yemen, reports of coordinated U.S. and Israeli military responses, and continued threats to commercial shipping all contributed to the move higher. The inflation implications of elevated energy prices are increasingly showing up in economic commentary as well. The latest Beige Book noted growing expectations that prices could move higher in coming months as uncertainty persists.
 Although some continue to characterize the inflationary impact of higher oil prices as temporary, financial markets appear less convinced. History has shown that energy shocks often have a tendency to linger longer than policymakers and economists initially expect. Of course, "temporary" frequently turns out to mean simply "not permanent."
The biggest story of the week, however, was not found in equities or commodities. It was in the Treasury market.
The 10-year Treasury yield staged a dramatic decline, breaking below both technical support and the psychologically relevant 5.00% level. The move culminated in a Thursday low of 4.93% before yields recovered modestly into the weekend. From both a technical and psychological standpoint, the move was significant. Investors who had become accustomed to a relentless march higher in yields were suddenly reminded how quickly the bond market can move when fear enters the equation.
That said, I do not view the rally as signaling the end of the broader uptrend in yields.
The fundamental forces that have driven rates higher, stubborn inflation concerns, heavy Treasury issuance, and resilient economic activity, remain largely intact. Rather than signaling a lasting reversal, this decline appears more consistent with a risk-off retracement driven by a flight to quality.
In that context, lower yields may ultimately prove to be an opportunity rather than a turning point. A move back above 5.02% would likely set the stage for another test of the recent 5.36% high, and potentially the 5.52% peak reached in 2001.
Looking ahead, next week's FOMC meeting is widely expected to result in no change to the Fed Funds target rate.
The more important question will be the tone of the accompanying statement and Chair Powell's press conference. Prior to entering the blackout period, Fed officials repeatedly emphasized their willingness to remain data dependent while also maintaining vigilance in their fight against inflation.
Recent upside surprises in both CPI and PPI have done little to alleviate inflation concerns. Yet Fed Funds futures continue to assign only a modest probability of a rate increase this week. Expectations for December remain considerably higher and have fluctuated between roughly 85% and fully priced-in odds of an additional hike.
For now, the market's message is clear: stocks may have grabbed the headlines, oil may have fueled inflation fears, but it was the bond market's plunge through 5% that defined the week.
The most important move on Wall Street wasn't higher oil or lower equities. It was seeing a number that many investors thought they might not see again anytime soon: a 4-handle on the 10-year Treasury yield.
From the Municipal Desk
Contributions from Ryan Riffe
The municipal market maintained its momentum for a second consecutive week, closely tracking the strength in the Treasury market. By Friday's close, benchmark yields had rallied between 10 and 33 basis points. Demand was strongest in the 1-20 year portion of the curve as attractive absolute yields and historically cheap ratios finally appeared to capture investors' attention.
Tax-loss harvesting continued to dominate market activity, pushing daily bid-wanted volume above 20,000 items.
That represents a significant increase from historical averages of roughly 10,000 to 13,000 offerings. The 10-year Treasury's break below the psychologically important 5.00% threshold, a level not seen in more than a month, appeared to be a key catalyst behind the improvement in investor sentiment.
Negotiated transactions were heavily oversubscribed across the curve, forcing many issuers to reprice deals to lower yield targets. The market will look to extend its October rebound through Fed Week, where a relatively modest $6 billion calendar of new issuance is expected to come to market.
Muni-Ratios
| 2-YR | 58% |
| 3YR | 60% |
| 5-YR | 64% |
| 10-YR | 71% |
| 30-YR | 91% |

An index is unmanaged and not available for direct investment. Definitions sourced from Bloomberg.
The Bloomberg Barclays Global Aggregate Negative Yielding Debt Market Value Index represents the portion of the Bloomberg Barclays Global Aggregate Index that measures the aggregate value of global debt with a negative yield. • The S&P 500® is widely regarded as the best single gauge of large-cap U.S. equities and serves as the foundation for a wide range of investment products. The index includes 500 leading companies and captures approximately 80% coverage of available market capitalization. • The NASDAQ Composite Index is a broad-based capitalization-weighted index of stocks in all three NASDAQ tiers: Global Select, Global Market and Capital Market. The index was developed with a base level of 100 as of February 5, 1971.• The Cboe Volatility Index® (VIX) is a calculation designed to produce a measure of constant, 30-day expected volatility of the US stock market, derived from real-time, mid-quote prices of weekly S&P 500® Index (SPX) call and put options with a range of 23 to 37 days to expiration.• The ICE BofA MOVE Index is a yield curve weighted index of the normalized implied volatility on 1-month Treasury options. It is the weighted average of implied volatilities on the CT2 (Current 2 Year Government Note), CT5 (Current 5 Year Government Note), CT10 (Current 10 Year Government Note), and CT30 (Current 30 Year Government Note), with weights 0.2/0.2/0.4/0.2 respectively.• The Markit CDX North America Investment Grade Index is composed of 125 equally weighted credit default swaps on investment grade entities, distributed among 6 sub-indices: High Volatility, Consumer, Energy, Financial, Industrial, and Technology, Media & Tele-communications. Markit CDX indices roll every 6 months in March & September. • The Markit CDX North America High Yield Index is composed of 100 non-investment grade entities, distributed among 2 sub-indices: B, BB. All entities are domiciled in North America. Markit CDX indices roll every 6 months in March & September. • The U.S. Dollar Index (USDX) indicates the general international value of the USD. The USDX does this by averaging the exchange rates between the USD and major world currencies. Intercontinental Exchange (ICE) US computes this by using the rates supplied by some 500 banks.
Investing involves certain risks, including possible loss of principal. You should understand and carefully consider a strategy’s objectives, risks, fees, expenses, and other information before investing. The views expressed in this commentary are subject to change and are not intended to be a recommendation or investment advice. Such views do not take into account the individual financial circumstances or objectives of any investor that receives them. All indices are unmanaged and are not available for direct investment. Indices do not incur costs including the payment of transaction costs, fees, and other expenses. This information should not be considered a solicitation or an offer to provide any service in any jurisdiction where it would be unlawful to do so under the laws of that jurisdiction. Past performance is no guarantee of future results.
© 2025 SWBC. All rights reserved. Securities offered through SWBC Investment Services, LLC, a registered broker/dealer. Member FINRA & SIPC. Advisory services offered through SWBC Investment Company, a Registered Investment Advisor, registered as such with the US Securities & Exchange Commission. SWBC Investment Services, LLC is under separate ownership from any other named entity. SWBC Investment Services, LLC a division of SWBC, is a nationwide partnership of advisor.

Let Us Know What You Thought about this Post.
Put your Comment Below.