
Inflation Headlines Should Have Dominated the Markets – But Jensen Huang Affair News Took Center Stage The bond market capitulated last week as a hotter-than-expected inflation print collided with gro...
Inflation Headlines Should Have Dominated the Markets – But Jensen Huang Affair News Took Center Stage
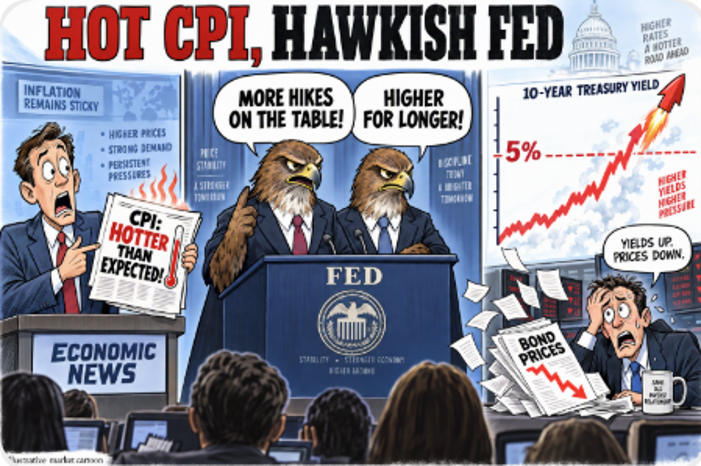
The bond market capitulated last week as a hotter-than-expected inflation print collided with growing concerns surrounding the sustainability of the artificial intelligence trade. While inflation ultimately proved to be the primary driver of price action, headlines surrounding reports and allegations involving Nvidia CEO Jensen Huang added another layer of uncertainty to a market already questioning lofty expectations for AI-related spending, revenue growth, and profitability.
 Volatility remains elevated and is likely to persist. The S&P 500 initially rebounded from the prior week's sharp sell-off before surrendering much of those gains by the end of the week.
Beneath the day-to-day fluctuations, the broader debate over AI economics continues to intensify.
Investors are increasingly scrutinizing whether the extraordinary levels of capital expenditure currently being directed toward data-center infrastructure will ultimately translate into earnings growth sufficient to justify current valuations. Until that question is answered more convincingly, additional downside risk cannot be ruled out.
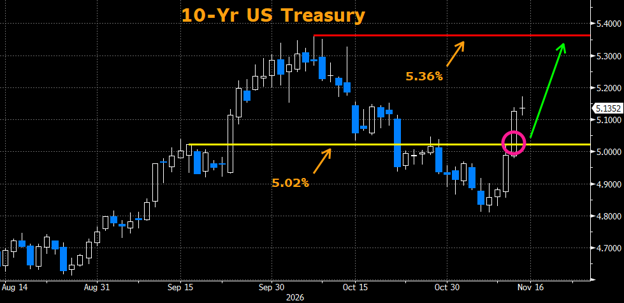
The Treasury market delivered the clearest verdict. After closing the prior week, near 4.81%, the yield on the 10-year Treasury surged through key technical resistance at 5.02% before finishing the week at 5.13%. The principal catalyst was Tuesday's Consumer Price Index report, which showed prices rising 0.4% month-over-month, exceeding consensus expectations and reinforcing concerns that inflation pressures remain stubbornly persistent.
While government statistical complications prevented a clean year-over-year comparison, the trend remains concerning.
CPI readings of 3.4% in August and 3.7% in September indicate that inflation has been moving in the wrong direction and remains far removed from the Federal Reserve's 2% objective.
Federal Reserve commentary amplified the market's reaction. Several policymakers adopted a noticeably more hawkish tone following the inflation report. Governor Christopher Waller was among the most aggressive, having suggested prior to the release that a 50-basis-point hike should be considered if inflation remained elevated.
Following the data, investors priced in more definitive tightening expectations with Fed Funds Futures probabilities exceeding 100% for December and raising the likelihood of a January repeat significantly.
Remarks from other Fed officials reinforced concerns that inflation may prove more persistent than previously anticipated and that further policy tightening could be required to restore price stability.
 My outlook for interest rates remains biased toward higher yields.
The same inflationary forces that drove Treasury yields to their October peak near 5.36% remain largely intact and were reinforced by last week's data. The decisive move above technical resistance suggests the path of least resistance remains higher, increasing the probability that yields revisit and potentially exceed prior cycle highs in the weeks ahead. For equity investors, particularly those heavily exposed to long-duration growth and AI-related themes, that represents an increasingly significant headwind.
From the Municipal Desk
Contributions from Ryan Riffe
Municipals followed the sharp retracement in Treasury yields this week, suffering their worst performance since early October. A stronger-than-expected CPI print combined with a hawkish Fed sent the 10-year Treasury soaring. There was nowhere to hide across the municipal curve, with benchmark yields rising 20 basis points on the front end and 15 basis points on the long end by Friday’s close. Even with supportive technicals, which included a light new issue calendar and a drastic drop in customer bid-wanteds, the municipal market could not stave off the broader selling pressure of global fixed income.
The market will look ahead to a full week of trading where issuance will nearly triple from the week prior to $14 Billion. Although reinvestment capital remains strong, the recent return to rate volatility could put market participants back on the sidelines. We expect this choppy trading environment to persist as long as Treasury yields remain volatile.
Muni-Ratios
| 2-YR | 58% |
| 3YR | 58% |
| 5-YR | 61% |
| 10-YR | 65% |
| 30-YR | 88% |

An index is unmanaged and not available for direct investment. Definitions sourced from Bloomberg.
The Bloomberg Barclays Global Aggregate Negative Yielding Debt Market Value Index represents the portion of the Bloomberg Barclays Global Aggregate Index that measures the aggregate value of global debt with a negative yield. • The S&P 500® is widely regarded as the best single gauge of large-cap U.S. equities and serves as the foundation for a wide range of investment products. The index includes 500 leading companies and captures approximately 80% coverage of available market capitalization. • The NASDAQ Composite Index is a broad-based capitalization-weighted index of stocks in all three NASDAQ tiers: Global Select, Global Market and Capital Market. The index was developed with a base level of 100 as of February 5, 1971.• The Cboe Volatility Index® (VIX) is a calculation designed to produce a measure of constant, 30-day expected volatility of the US stock market, derived from real-time, mid-quote prices of weekly S&P 500® Index (SPX) call and put options with a range of 23 to 37 days to expiration.• The ICE BofA MOVE Index is a yield curve weighted index of the normalized implied volatility on 1-month Treasury options. It is the weighted average of implied volatilities on the CT2 (Current 2 Year Government Note), CT5 (Current 5 Year Government Note), CT10 (Current 10 Year Government Note), and CT30 (Current 30 Year Government Note), with weights 0.2/0.2/0.4/0.2 respectively.• The Markit CDX North America Investment Grade Index is composed of 125 equally weighted credit default swaps on investment grade entities, distributed among 6 sub-indices: High Volatility, Consumer, Energy, Financial, Industrial, and Technology, Media & Tele-communications. Markit CDX indices roll every 6 months in March & September. • The Markit CDX North America High Yield Index is composed of 100 non-investment grade entities, distributed among 2 sub-indices: B, BB. All entities are domiciled in North America. Markit CDX indices roll every 6 months in March & September. • The U.S. Dollar Index (USDX) indicates the general international value of the USD. The USDX does this by averaging the exchange rates between the USD and major world currencies. Intercontinental Exchange (ICE) US computes this by using the rates supplied by some 500 banks.
Investing involves certain risks, including possible loss of principal. You should understand and carefully consider a strategy’s objectives, risks, fees, expenses, and other information before investing. The views expressed in this commentary are subject to change and are not intended to be a recommendation or investment advice. Such views do not take into account the individual financial circumstances or objectives of any investor that receives them. All indices are unmanaged and are not available for direct investment. Indices do not incur costs including the payment of transaction costs, fees, and other expenses. This information should not be considered a solicitation or an offer to provide any service in any jurisdiction where it would be unlawful to do so under the laws of that jurisdiction. Past performance is no guarantee of future results.
© 2025 SWBC. All rights reserved. Securities offered through SWBC Investment Services, LLC, a registered broker/dealer. Member FINRA & SIPC. Advisory services offered through SWBC Investment Company, a Registered Investment Advisor, registered as such with the US Securities & Exchange Commission. SWBC Investment Services, LLC is under separate ownership from any other named entity. SWBC Investment Services, LLC a division of SWBC, is a nationwide partnership of advisor.

Let Us Know What You Thought about this Post.
Put your Comment Below.