
Strait Ahead? Or are the Paths for Oil and Markets Still Erratic? The Strait of Hormuz has effectively reopened, with energy shipments once again moving through one of the world's most critical trade ...
From Melt-Up to Shake-Out: Markets Reverse Hard
Markets sold off sharply following Friday’s upside surprise in Nonfarm Payrolls. While the unemployment rate held steady at 4.3%, firmly within the range of full employment, the labor market showed little sign of cooling where it matters most for policy. Instead, the headline payroll gain of +172k, nearly double the +88k consensus estimate, combined with upward revisions to prior months, forced a rapid repricing across asset classes.
Equities bore the brunt of the move. The S&P 500 fell roughly 2%, the Russell 2000 dropped 2.7%, and the Nasdaq declined 3.4%, led lower by technology and AI-linked names. The stronger-than-expected data effectively removed any near-term expectations for Fed easing, acting as the initial catalyst for the selloff. That pressure was compounded by profit-taking following an extended rally in growth stocks and growing signs of fatigue in the crowded AI trade.
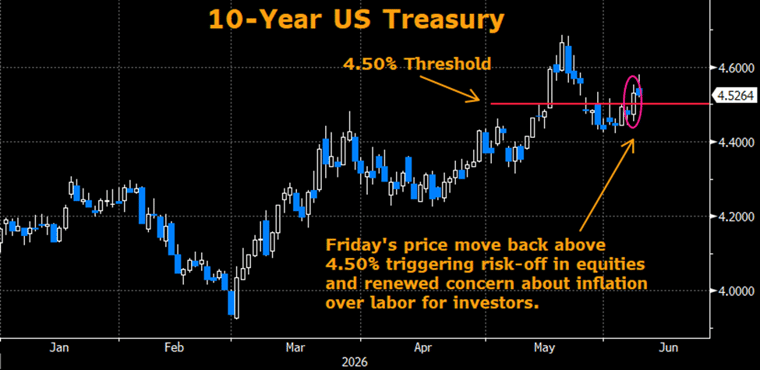
Rates quickly moved to the forefront. The 10-year Treasury yield broke back above the critical 4.50% level, reinforcing a higher-for-longer narrative. A resilient labor market has shifted investor focus back toward inflation persistence rather than growth concerns, driving renewed weakness in bonds.
Historically, yields above 4.50% have represented a tipping point for risk assets, tightening financial conditions, and pressuring valuations. As expected, that dynamic hit long-duration equities - particularly tech and AI - disproportionately, as a higher risk-free rate compresses multiples.
While equity and rates markets dominated attention, energy remains a key macro variable. Brent crude moved modestly higher over the weekend amid ongoing tensions with Iran, but failed to breach the psychologically important $100/bbl threshold that would signal a more acute inflation shock.
From a positioning standpoint, Treasury futures broke and faded from key technical support, allowing our short position to reach its initial target -aligned with the move above 4.50% in cash yields. The next technical objective sits near 4.68%, where further dislocation driven by inflation concerns and geopolitical risks could extend the move.
From the Municipal Desk (with contributions from Ryan Riffe):
June's heavy reinvestment capital matched another explosive week of inflows ($1.4 billion), which helped the market maintain momentum for a second consecutive week. From retail and SMA to funds and ETFs, demand came from all corners of the market. By Friday's close, benchmark yields dropped as much as eight basis points in certain parts of the curve. The market flexed its resiliency by persevering through a week of geopolitical tension, inflationary headwinds, and one of the largest weekly new issue calendars year to date ($20+ Billion). The primary calendar is expected to drop next week to $14 Billion, which should be well-received based on efforts seen this week.
Municipals outperformed the big move higher in treasury rates experienced on Friday. This in turn has made Muni/UST ratios richen to levels the market has not seen since March. However, given the positive backdrop in the current market, we believe ratios have the ability to trade at richer levels for the near term.
| Muni-Ratios | Week Prior |
|
2-YR Ratio @ 58% 3-YR Ratio @ 58% 5-YR Ratio @ 60% 10-YR Ratio @ 65% 30-YR Ratio @ 86% |
2-YR Ratio @ 61% 3-YR Ratio @ 62% 5-YR Ratio @ 64% 10-YR Ratio @ 68% 30-YR Ratio @ 88% |

An index is unmanaged and not available for direct investment. Definitions sourced from Bloomberg.
The Bloomberg Barclays Global Aggregate Negative Yielding Debt Market Value Index represents the portion of the Bloomberg Barclays Global Aggregate Index that measures the aggregate value of global debt with a negative yield. • The S&P 500® is widely regarded as the best single gauge of large-cap U.S. equities and serves as the foundation for a wide range of investment products. The index includes 500 leading companies and captures approximately 80% coverage of available market capitalization. • The NASDAQ Composite Index is a broad-based capitalization-weighted index of stocks in all three NASDAQ tiers: Global Select, Global Market and Capital Market. The index was developed with a base level of 100 as of February 5, 1971.• The Cboe Volatility Index® (VIX) is a calculation designed to produce a measure of constant, 30-day expected volatility of the US stock market, derived from real-time, mid-quote prices of weekly S&P 500® Index (SPX) call and put options with a range of 23 to 37 days to expiration.• The ICE BofA MOVE Index is a yield curve weighted index of the normalized implied volatility on 1-month Treasury options. It is the weighted average of implied volatilities on the CT2 (Current 2 Year Government Note), CT5 (Current 5 Year Government Note), CT10 (Current 10 Year Government Note), and CT30 (Current 30 Year Government Note), with weights 0.2/0.2/0.4/0.2 respectively.• The Markit CDX North America Investment Grade Index is composed of 125 equally weighted credit default swaps on investment grade entities, distributed among 6 sub-indices: High Volatility, Consumer, Energy, Financial, Industrial, and Technology, Media & Tele-communications. Markit CDX indices roll every 6 months in March & September. • The Markit CDX North America High Yield Index is composed of 100 non-investment grade entities, distributed among 2 sub-indices: B, BB. All entities are domiciled in North America. Markit CDX indices roll every 6 months in March & September. • The U.S. Dollar Index (USDX) indicates the general international value of the USD. The USDX does this by averaging the exchange rates between the USD and major world currencies. Intercontinental Exchange (ICE) US computes this by using the rates supplied by some 500 banks.
Investing involves certain risks, including possible loss of principal. You should understand and carefully consider a strategy’s objectives, risks, fees, expenses, and other information before investing. The views expressed in this commentary are subject to change and are not intended to be a recommendation or investment advice. Such views do not take into account the individual financial circumstances or objectives of any investor that receives them. All indices are unmanaged and are not available for direct investment. Indices do not incur costs including the payment of transaction costs, fees, and other expenses. This information should not be considered a solicitation or an offer to provide any service in any jurisdiction where it would be unlawful to do so under the laws of that jurisdiction. Past performance is no guarantee of future results.
© 2025 SWBC. All rights reserved. Securities offered through SWBC Investment Services, LLC, a registered broker/dealer. Member FINRA & SIPC. Advisory services offered through SWBC Investment Company, a Registered Investment Advisor, registered as such with the US Securities & Exchange Commission. SWBC Investment Services, LLC is under separate ownership from any other named entity. SWBC Investment Services, LLC a division of SWBC, is a nationwide partnership of advisor.

Let Us Know What You Thought about this Post.
Put your Comment Below.