
Housing market fundamentals remain challenging, with affordability continuing to be the industry's primary hurdle as home prices remain elevated relative to household incomes and price-to-income ratio...
Strait Ahead? Or are the Paths for Oil and Markets Still Erratic?
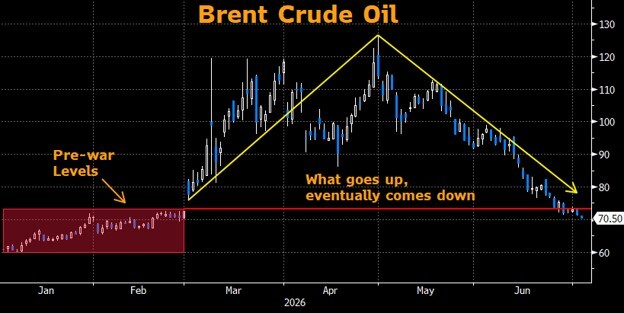
The Strait of Hormuz has effectively reopened, with energy shipments once again moving through one of the world's most critical trade corridors. While tensions between Iran and the United States remain elevated, the market's immediate fear premium has largely evaporated. Brent crude, which briefly surged to approximately $126 per barrel during the height of the conflict, has retraced nearly the entire move and now trades near $70 per barrel.
That decline is unquestionably constructive for the inflation outlook. Yet while oil prices have fallen rapidly, inflation expectations and consumer concerns have not followed suit. The lag between easing commodity prices and improving consumer sentiment remains evident in the latest economic data.
 Despite last week's holiday-shortened trading schedule, investors had plenty to digest. Tuesday's JOLTS report showed job openings climbing to 7594k, a two-year high that comfortably exceeded consensus expectations of 7296k. Consumer Confidence improved to 91.2 from the prior month, though it fell short of the anticipated 94.4 reading. Notably, survey respondents cited lower oil prices as a source of relief, but concerns surrounding employment remained elevated. The percentage of consumers indicating jobs were "hard to get" rose to 22.5%, the highest level since January.
Thursday's labor market data delivered a similarly mixed message. Nonfarm Payrolls slowed sharply to just 57,000 jobs added, suggesting some moderation in hiring activity. However, the unemployment rate declined to 4.2%, reinforcing the view that labor market conditions remain broadly resilient. In recent weeks, several economists have revised their forecasts to include one or more Federal Reserve rate hikes before year-end. Sticky inflation, combined with a labor market that remains fundamentally intact, continues to diminish the case for near-term policy easing.
Federal Reserve Chair Kevin Warsh maintained the theme established during his initial press conference: less forward guidance and greater policy flexibility. Several Fed officials echoed concerns about ongoing inflation throughout the week. While no policymaker explicitly advocated for additional rate hikes, it became increasingly clear that the Committee's center of gravity remains more hawkish than dovish.
Equity markets largely looked through these concerns. The S&P 500 advanced steadily throughout the week despite weakness within segments of the AI ecosystem. Semiconductor and memory-chip manufacturers remained under pressure, a dynamic I discussed during my appearance on Bloomberg: The Asia Trade. South Korea's KOSPI Index, heavily exposed to the memory-chip supply chain, continued to feel the impact of sharp declines in SK Hynix and Samsung shares. In the United States, Micron also extended its recent weakness. Seasonal summer trading patterns can occasionally introduce periods of consolidation, but such volatility may provide attractive entry points for investors seeking exposure to high-growth AI and AI-adjacent companies.
Looking ahead, my base case remains unchanged. I continue to anticipate one Federal Reserve rate hike this year, with a second increase remaining a possibility rather than a probability. Warsh's approach and rhetoric appears intentional and may succeed in tightening financial conditions without requiring immediate policy action. While I believe inflation has likely peaked near the 4% level, the FOMC remains committed to driving inflation materially lower. As Chair Warsh himself has emphasized, sustained progress - not temporary relief - will determine the path of monetary policy.
From the Municipal Desk
Contributions from Ryan Riffe
With June and the first half of 2026 now in the rearview mirror, the municipal market enjoyed a well-deserved breather during the holiday-shortened trading week. To call the first six months of the year eventful would be an understatement. Despite persistent rate volatility, economic uncertainty, and a steady stream of geopolitical headlines, municipals have continued to demonstrate impressive resilience.
A key driver of that strength has been the remarkably consistent demand from muni funds and ETFs. According to Lipper data, there has been just one week of net outflows year-to-date. Even more impressive, nearly 60% of weekly inflows have exceeded $1 billion. That demand has provided a critical foundation for the market as investors have been forced to absorb a record pace of issuance.
Importantly, there is little indication that the supply story is about to change. Market participants broadly expect 2026 issuance to eclipse the record-setting levels established in 2025, keeping the new-issue calendar firmly in focus throughout the second half of the year. Under normal circumstances, that kind of supply backdrop could prove challenging. However, seasonal summer technicals are now taking center stage, and they should continue to provide a meaningful tailwind for the asset class.
As things stand today, the same forces that have supported municipal performance throughout the year - strong fund flows, steady investor demand, and favorable technical conditions - remain firmly in place. While volatility is unlikely to disappear entirely, the municipal market appears well-positioned to carry its momentum into the second half of 2026.
Weekly Supply Estimate: ~$10 Billion
Muni Ratios (vs. prior week)
- 2-Year: 57% (58%)
- 3-Year: 59% (60%)
- 5-Year: 61% (63%)
- 10-Year: 66% (68%)
- 30-Year: 85% (87%)

An index is unmanaged and not available for direct investment. Definitions sourced from Bloomberg.
The Bloomberg Barclays Global Aggregate Negative Yielding Debt Market Value Index represents the portion of the Bloomberg Barclays Global Aggregate Index that measures the aggregate value of global debt with a negative yield. • The S&P 500® is widely regarded as the best single gauge of large-cap U.S. equities and serves as the foundation for a wide range of investment products. The index includes 500 leading companies and captures approximately 80% coverage of available market capitalization. • The NASDAQ Composite Index is a broad-based capitalization-weighted index of stocks in all three NASDAQ tiers: Global Select, Global Market and Capital Market. The index was developed with a base level of 100 as of February 5, 1971.• The Cboe Volatility Index® (VIX) is a calculation designed to produce a measure of constant, 30-day expected volatility of the US stock market, derived from real-time, mid-quote prices of weekly S&P 500® Index (SPX) call and put options with a range of 23 to 37 days to expiration.• The ICE BofA MOVE Index is a yield curve weighted index of the normalized implied volatility on 1-month Treasury options. It is the weighted average of implied volatilities on the CT2 (Current 2 Year Government Note), CT5 (Current 5 Year Government Note), CT10 (Current 10 Year Government Note), and CT30 (Current 30 Year Government Note), with weights 0.2/0.2/0.4/0.2 respectively.• The Markit CDX North America Investment Grade Index is composed of 125 equally weighted credit default swaps on investment grade entities, distributed among 6 sub-indices: High Volatility, Consumer, Energy, Financial, Industrial, and Technology, Media & Tele-communications. Markit CDX indices roll every 6 months in March & September. • The Markit CDX North America High Yield Index is composed of 100 non-investment grade entities, distributed among 2 sub-indices: B, BB. All entities are domiciled in North America. Markit CDX indices roll every 6 months in March & September. • The U.S. Dollar Index (USDX) indicates the general international value of the USD. The USDX does this by averaging the exchange rates between the USD and major world currencies. Intercontinental Exchange (ICE) US computes this by using the rates supplied by some 500 banks.
Investing involves certain risks, including possible loss of principal. You should understand and carefully consider a strategy’s objectives, risks, fees, expenses, and other information before investing. The views expressed in this commentary are subject to change and are not intended to be a recommendation or investment advice. Such views do not take into account the individual financial circumstances or objectives of any investor that receives them. All indices are unmanaged and are not available for direct investment. Indices do not incur costs including the payment of transaction costs, fees, and other expenses. This information should not be considered a solicitation or an offer to provide any service in any jurisdiction where it would be unlawful to do so under the laws of that jurisdiction. Past performance is no guarantee of future results.
© 2025 SWBC. All rights reserved. Securities offered through SWBC Investment Services, LLC, a registered broker/dealer. Member FINRA & SIPC. Advisory services offered through SWBC Investment Company, a Registered Investment Advisor, registered as such with the US Securities & Exchange Commission. SWBC Investment Services, LLC is under separate ownership from any other named entity. SWBC Investment Services, LLC a division of SWBC, is a nationwide partnership of advisor.
Let Us Know What You Thought about this Post.
Put your Comment Below.