
Housing market fundamentals remain challenging, with affordability continuing to be the industry's primary hurdle as home prices remain elevated relative to household incomes and price-to-income ratio...
The Long End Bites Back and the Treasury Buyback Initiative is Dismissed
Despite August's seasonal slowdown and thin staffing across trading desks, markets found reasons to create some angst. Investors continued to look through July's disappointing Nonfarm Payroll report, interpreting the weaker labor data as validation of the Fed's decision to hold rates steady at its July meeting. With September hike odds remaining below 40%, market participants continue to view a policy pause as the most likely outcome. Importantly, policymakers will receive both August payroll and CPI data before the next FOMC meeting, but for now the path of least resistance remains no change for Fed policy.
 Meanwhile, developments outside the domestic economy continued to pressure markets. Brent crude oil climbed steadily throughout the week, closing above $94 per barrel - reinforcing concerns that geopolitical tensions in the Middle East may yet translate into renewed inflationary pressure.
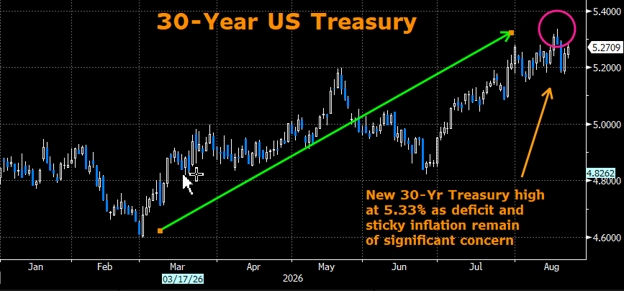
The fixed income market remained the primary source of volatility. Early in the week, the long end of the Treasury curve continued its recent selloff, with the 30-year Treasury yield reaching 5.33% in a pronounced bear steepening move. Markets appear increasingly concerned that inflation risks have not been fully extinguished, while the combination of a federal debt burden now exceeding $40 trillion and persistent deficit financing requirements has refocused attention on long-term fiscal sustainability.
Against this backdrop, investors have once again begun to discuss the potential influence of so-called "bond vigilantes" as the market tests policymakers' commitment to preserving price stability.
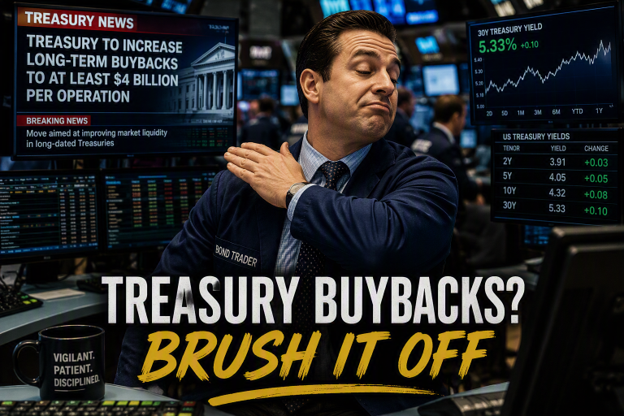
Treasury Secretary Bessent's announcement that the Treasury Department would expand fourth-quarter buyback operations for long-dated securities provided a temporary reprieve. Long-end yields initially rallied on the news before retracing much of the move. My initial assessment remains that the program is unlikely to have a lasting impact on rates. The buybacks are primarily targeted at off-the-run securities and are intended to improve market liquidity and dealer balance-sheet capacity rather than materially alter Treasury supply dynamics. Moreover, the scale of ongoing issuance remains sufficiently large to offset any reduction in available securities. Most importantly, Treasury has framed the initiative as a liquidity-management tool rather than an effort to actively manage the government's debt profile.
That distinction matters. While the announcement may improve market functioning at the margin, it also introduces an additional policy variable into a market already attempting to assess the course of monetary policy.
Treasury actions that directly influence long-end pricing risk complicating the Federal Reserve's efforts to transmit policy through financial conditions, potentially blurring the lines between debt management and monetary policy.
The release of the July FOMC minutes did little to alter the market narrative. The minutes confirmed what investors already suspected: several participants favored an immediate rate hike, while many others expressed concern that additional tightening may ultimately be necessary if inflation fails to moderate further. The Committee remains firmly data-dependent, and upcoming inflation and labor-market reports will likely determine whether current policy is sufficiently restrictive.
Equity markets delivered their own verdict on the week's developments. Rising oil prices and higher long-term interest rates steadily pressured risk assets, driving the S&P 500 below the 7,700 level. The move appeared less a reflection of deteriorating economic fundamentals and more a repricing of valuation assumptions as discount rates moved higher. Growth-oriented sectors, particularly those with elevated duration characteristics, bore the brunt of the adjustment.
Seasonally, the weakness is not without precedent. August has historically been prone to episodes of volatility even in otherwise constructive market environments. With more than a week remaining in the month, investors should not be surprised if further downside pressure emerges, particularly should oil prices continue to climb or long-term Treasury yields remain near cycle highs.
For now, the message from markets is straightforward: higher rates are once again tightening financial conditions, and both bond and equity investors are being forced to recalibrate accordingly.
From the Municipal Desk
Contributions from Ryan Riffe
The municipal market successfully absorbed last week's sizeable $15 billion primary calendar, but not without cost. Spreads widened by as much as 15 basis points in the intermediate portion of the curve as dealers and investors contended with significant Treasury market volatility. Robust mutual fund inflows and seasonal reinvestment cash provided a supportive technical backdrop, yet these factors proved insufficient to fully offset the pressure exerted by heavier supply. Secondary market activity reflected a more cautious tone, with participants demanding additional concession as rates moved higher.
Looking ahead, the supply calendar remains elevated, with approximately $17 billion of new issuance expected this week.
Given the already heavy issuance pipeline, further municipal cheapening would not be surprising as dealers seek to manage balance sheet exposure and preserve underwriting capacity. Buy-side attention is likely to remain concentrated on the primary market, potentially limiting support for secondary trading and creating additional opportunities for patient investors.
Beyond supply and rates, concerns regarding the federal fiscal outlook have once again surfaced as a potential overhang for the municipal market. As policymakers continue to explore avenues for budget savings and deficit reduction, the municipal tax exemption has re-emerged in periodic policy discussions. While the probability of any near-term change remains low and no immediate legislative threat appears imminent, the issue warrants continued monitoring. Municipal market participants should remain engaged in educating Congressional and Senate leaders on the longstanding value of the tax exemption, emphasizing its role in lowering borrowing costs for state and local governments and ultimately benefiting taxpayers through more efficient financing of essential public infrastructure.

An index is unmanaged and not available for direct investment. Definitions sourced from Bloomberg.
The Bloomberg Barclays Global Aggregate Negative Yielding Debt Market Value Index represents the portion of the Bloomberg Barclays Global Aggregate Index that measures the aggregate value of global debt with a negative yield. • The S&P 500® is widely regarded as the best single gauge of large-cap U.S. equities and serves as the foundation for a wide range of investment products. The index includes 500 leading companies and captures approximately 80% coverage of available market capitalization. • The NASDAQ Composite Index is a broad-based capitalization-weighted index of stocks in all three NASDAQ tiers: Global Select, Global Market and Capital Market. The index was developed with a base level of 100 as of February 5, 1971.• The Cboe Volatility Index® (VIX) is a calculation designed to produce a measure of constant, 30-day expected volatility of the US stock market, derived from real-time, mid-quote prices of weekly S&P 500® Index (SPX) call and put options with a range of 23 to 37 days to expiration.• The ICE BofA MOVE Index is a yield curve weighted index of the normalized implied volatility on 1-month Treasury options. It is the weighted average of implied volatilities on the CT2 (Current 2 Year Government Note), CT5 (Current 5 Year Government Note), CT10 (Current 10 Year Government Note), and CT30 (Current 30 Year Government Note), with weights 0.2/0.2/0.4/0.2 respectively.• The Markit CDX North America Investment Grade Index is composed of 125 equally weighted credit default swaps on investment grade entities, distributed among 6 sub-indices: High Volatility, Consumer, Energy, Financial, Industrial, and Technology, Media & Tele-communications. Markit CDX indices roll every 6 months in March & September. • The Markit CDX North America High Yield Index is composed of 100 non-investment grade entities, distributed among 2 sub-indices: B, BB. All entities are domiciled in North America. Markit CDX indices roll every 6 months in March & September. • The U.S. Dollar Index (USDX) indicates the general international value of the USD. The USDX does this by averaging the exchange rates between the USD and major world currencies. Intercontinental Exchange (ICE) US computes this by using the rates supplied by some 500 banks.
Investing involves certain risks, including possible loss of principal. You should understand and carefully consider a strategy’s objectives, risks, fees, expenses, and other information before investing. The views expressed in this commentary are subject to change and are not intended to be a recommendation or investment advice. Such views do not take into account the individual financial circumstances or objectives of any investor that receives them. All indices are unmanaged and are not available for direct investment. Indices do not incur costs including the payment of transaction costs, fees, and other expenses. This information should not be considered a solicitation or an offer to provide any service in any jurisdiction where it would be unlawful to do so under the laws of that jurisdiction. Past performance is no guarantee of future results.
© 2025 SWBC. All rights reserved. Securities offered through SWBC Investment Services, LLC, a registered broker/dealer. Member FINRA & SIPC. Advisory services offered through SWBC Investment Company, a Registered Investment Advisor, registered as such with the US Securities & Exchange Commission. SWBC Investment Services, LLC is under separate ownership from any other named entity. SWBC Investment Services, LLC a division of SWBC, is a nationwide partnership of advisor.

Let Us Know What You Thought about this Post.
Put your Comment Below.