
Strait Ahead? Or are the Paths for Oil and Markets Still Erratic? The Strait of Hormuz has effectively reopened, with energy shipments once again moving through one of the world's most critical trade ...
For the fourth consecutive week - and ever since the outbreak of conflict with Iran - financial markets have exhibited elevated volatility and persistent weakness. Day‑to‑day market direction has hinged almost entirely on shifting geopolitical headlines, oscillating between signs of potential de‑escalation and renewed fears of expansion. President Trump’s alternating signals, ranging from optimism about peace negotiations and temporary pauses in military strikes to threats of ground‑troop deployment and vows to “annihilate” Iran, if necessary, have kept investor sentiment on edge. Iran, for its part, has provided little reason for optimism: sustained strikes on neighboring countries and repeated denials that negotiations are taking place have reinforced expectations that conflict may persist.
With oil prices continuing to trade at elevated levels, equity markets have remained under pressure while fixed‑income markets adjust to a higher‑rate reality. The central narrative remains intact: sustained increases in energy prices threaten to fuel broader inflationary pressures and weigh on global economic growth. Even if the conflict finds a near‑term resolution, a swift return to pre‑war oil production and distribution is unlikely. The inflationary impulse generated by this period of elevated prices will linger, influencing both market behavior and economic data for months to come. Nevertheless, history suggests that markets often recover ahead of tangible improvements - rebounding on expectations of a more favorable forward‑looking environment.
The S&P 500 has now fallen nearly 9% from its January high of 7002, placing it on the cusp of correction territory. Historically, geopolitical shocks, particularly those tied to military conflict, tend to exert only temporary pressure on financial markets, with recoveries following soon after clarity emerges. The key question for investors is not whether markets will rebound, but when. Should weakness deepen into a full bear‑market drawdown, patient investors may ultimately find themselves well‑positioned to benefit from the next upswing in economic growth and risk appetite.
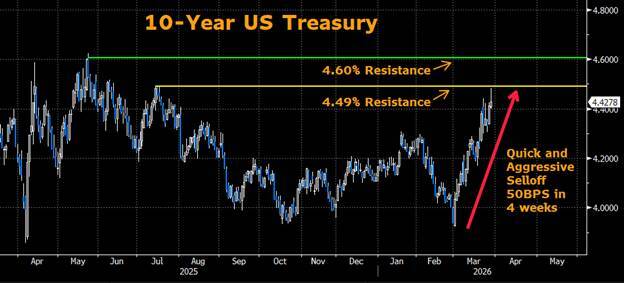
Rising inflation expectations and heightened risk premia have pushed Treasury yields sharply higher over the past month. On Friday, 10‑year yields rose to 4.48%, approaching the intermediate resistance levels we identified in prior communications. Not long ago, many forecasters expected sub‑4% yields to become the norm in 2026, an outlook that I never ascribed to and which now appears increasingly unrealistic. Rates are likely to remain elevated for the remainder of the year. Should upward pressure persist, the 2025 post‑Liberation Day high of 4.63% may soon be tested, with the January 2025 peak of 4.81% potentially entering the conversation.
Meanwhile, the conflict has pushed several otherwise meaningful economic and market stories out of the spotlight. Concerns about overinvestment in the technology sector, including circular financing dynamics among leading firms, and anxieties that traditional software businesses could be disrupted by rapid advances in AI have largely faded from public discourse - despite notable declines in software valuations earlier this year. While AI‑driven disruption will undoubtedly create both winners and losers, broad expectations of a wholesale displacement of software incumbents appear exaggerated.
Similarly absent from the recent news cycle is the expanding federal deficit, which is almost certainly worsening as military engagement continues. Private‑equity liquidity concerns also resurfaced at quarter‑end, with several alternative‑asset managers imposing redemption limits (“gates”) to prevent disorderly outflows. While such liquidity constraints may unsettle some investors, they remain an intentional feature, not a flaw, of the fund structures that enable greater leverage and return potential within the private‑markets ecosystem. But the structure comes with increased risk and requires appropriate understanding from investors interested in pursuing outsized returns.
In sum, while geopolitical risk remains the dominant force shaping market behavior, a range of underlying structural and cyclical issues continues to build beneath the surface. As history frequently demonstrates, periods of heightened uncertainty ultimately give way to renewed opportunity for disciplined investors.
From the Municipal Desk (with contributions from Ryan Riffe):
Market volatility persisted for another week as geopolitical concerns continue to dominate headlines. Monday's quiet tone was short-lived as volatility quickly returned Tuesday morning. Elevated fears about the global economic impact regarding the US-Iran conflict continued to rattle municipals along with other markets. Not only have expectations for Fed cuts been eliminated, but markets have now priced in a slight chance of a Fed hike, a complete shift from consensus just several weeks prior. Municipals followed the Treasury market closely as benchmark yields rose by as much as 12 basis points and included a flattening of the municipal curve. By Friday's close, the 1-to-5-year part of the curve saw yields increase by as much as 19 basis points in certain spots.
In a week where positive takeaways were limited, there was one notable highlight: municipals outperformed Treasuries. What makes this especially encouraging is that they accomplished this amidst an increase in supply (one of the largest weekly calendars YTD), fund outflows, and extreme market volatility.
With just four and a half trading days next week, the new issue calendar will drop nearly in half to $7.8 Billion. Market participants are hopeful that this decrease in supply, combined with April 1st reinvestment capital, may provide for somewhat of a stable week.
Weekly Supply @ $7.8 Billion
2-YR Ratio @ 62%
3-YR Ratio @ 64
5-YR Ratio @ 66%
10-YR Ratio @ 72%
30-YR Ratio @ 91%

An index is unmanaged and not available for direct investment. Definitions sourced from Bloomberg.
The Bloomberg Barclays Global Aggregate Negative Yielding Debt Market Value Index represents the portion of the Bloomberg Barclays Global Aggregate Index that measures the aggregate value of global debt with a negative yield. • The S&P 500® is widely regarded as the best single gauge of large-cap U.S. equities and serves as the foundation for a wide range of investment products. The index includes 500 leading companies and captures approximately 80% coverage of available market capitalization. • The NASDAQ Composite Index is a broad-based capitalization-weighted index of stocks in all three NASDAQ tiers: Global Select, Global Market and Capital Market. The index was developed with a base level of 100 as of February 5, 1971.• The Cboe Volatility Index® (VIX) is a calculation designed to produce a measure of constant, 30-day expected volatility of the US stock market, derived from real-time, mid-quote prices of weekly S&P 500® Index (SPX) call and put options with a range of 23 to 37 days to expiration.• The ICE BofA MOVE Index is a yield curve weighted index of the normalized implied volatility on 1-month Treasury options. It is the weighted average of implied volatilities on the CT2 (Current 2 Year Government Note), CT5 (Current 5 Year Government Note), CT10 (Current 10 Year Government Note), and CT30 (Current 30 Year Government Note), with weights 0.2/0.2/0.4/0.2 respectively.• The Markit CDX North America Investment Grade Index is composed of 125 equally weighted credit default swaps on investment grade entities, distributed among 6 sub-indices: High Volatility, Consumer, Energy, Financial, Industrial, and Technology, Media & Tele-communications. Markit CDX indices roll every 6 months in March & September. • The Markit CDX North America High Yield Index is composed of 100 non-investment grade entities, distributed among 2 sub-indices: B, BB. All entities are domiciled in North America. Markit CDX indices roll every 6 months in March & September. • The U.S. Dollar Index (USDX) indicates the general international value of the USD. The USDX does this by averaging the exchange rates between the USD and major world currencies. Intercontinental Exchange (ICE) US computes this by using the rates supplied by some 500 banks.
Investing involves certain risks, including possible loss of principal. You should understand and carefully consider a strategy’s objectives, risks, fees, expenses, and other information before investing. The views expressed in this commentary are subject to change and are not intended to be a recommendation or investment advice. Such views do not take into account the individual financial circumstances or objectives of any investor that receives them. All indices are unmanaged and are not available for direct investment. Indices do not incur costs including the payment of transaction costs, fees, and other expenses. This information should not be considered a solicitation or an offer to provide any service in any jurisdiction where it would be unlawful to do so under the laws of that jurisdiction. Past performance is no guarantee of future results.
© 2025 SWBC. All rights reserved. Securities offered through SWBC Investment Services, LLC, a registered broker/dealer. Member FINRA & SIPC. Advisory services offered through SWBC Investment Company, a Registered Investment Advisor, registered as such with the US Securities & Exchange Commission. SWBC Investment Services, LLC is under separate ownership from any other named entity. SWBC Investment Services, LLC a division of SWBC, is a nationwide partnership of advisor.

Let Us Know What You Thought about this Post.
Put your Comment Below.