
Strait Ahead? Or are the Paths for Oil and Markets Still Erratic? The Strait of Hormuz has effectively reopened, with energy shipments once again moving through one of the world's most critical trade ...
Capital Markets
|
4 min read
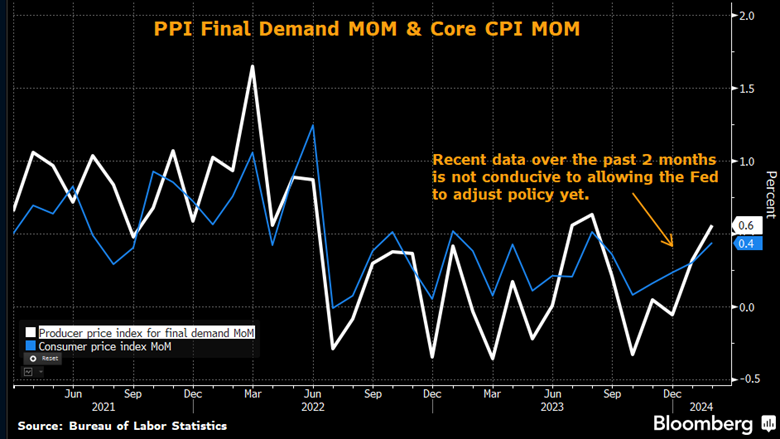
After closing the prior week near the early February lows and hinting at further push lower, interest rates rose throughout last week. The 4.35% support level is again in play on 10-year UST on the high side of the market. The past two months of economic data have done little to quell market concerns that inflation is contained. Specifically, Core, CPI, and PPI came in at +0.4% MOM and +3.8% and +2.8% respectively YOY. Also notable was that PPI Final Demand pushed higher to +0.6% MOM and +1.6% YOY. A solid economy, resilient consumer, and better-than-expected jobs market continue to offer the Fed the backdrop to remain consistent with their resolve to maintain the Federal Funds Target rate at 5.25-5.50% to combat any persistent threat of inflation. Furthermore, this definitively brings into question the Fed’s dot plot and suggests there is a solid argument to be made for reducing the expected cuts from 3 to 2 this year. However, some economists and market pundits continue to push for earlier and greater rate cuts by the FOMC.
Municipals again outperformed the broader interest rate market with only modest moves higher in the belly of the curve and no change on the long end, according to the BVAL AAA Municipal Curve. Naturally, ratios as a percent of Treasuries again dipped below the 60% level due to the strong demand. Buyers absorbed last week's heavier supply well, but new issuance is expected to be a more normalized $5.7 billion this coming week. Typically, by March, we hope to see some signs of cheapening municipal yields compared to Treasuries as we approach the April 15th tax deadline. It's unclear if this pattern will repeat in 2024.
SWBC continues to receive steady interest in duration extension trades as PMs target the more extended portion of their respective portfolio constraints. Despite the changes in the market, the interest rates on the shorter end of the yield curve have remained stable. The continued inverted shape of the municipal curve provides an incentive for buyers to participate inside the 3-year range.

An index is unmanaged and not available for direct investment. Definitions sourced from Bloomberg.
The Bloomberg Barclays Global Aggregate Negative Yielding Debt Market Value Index represents the portion of the Bloomberg Barclays Global Aggregate Index that measures the aggregate value of global debt with a negative yield. • The S&P 500® is widely regarded as the best single gauge of large-cap U.S. equities and serves as the foundation for a wide range of investment products. The index includes 500 leading companies and captures approximately 80% coverage of available market capitalization. • The NASDAQ Composite Index is a broad-based capitalization-weighted index of stocks in all three NASDAQ tiers: Global Select, Global Market and Capital Market. The index was developed with a base level of 100 as of February 5, 1971.• The Cboe Volatility Index® (VIX) is a calculation designed to produce a measure of constant, 30-day expected volatility of the US stock market, derived from real-time, mid-quote prices of weekly S&P 500® Index (SPX) call and put options with a range of 23 to 37 days to expiration.• The ICE BofA MOVE Index is a yield curve weighted index of the normalized implied volatility on 1-month Treasury options. It is the weighted average of implied volatilities on the CT2 (Current 2 Year Government Note), CT5 (Current 5 Year Government Note), CT10 (Current 10 Year Government Note), and CT30 (Current 30 Year Government Note), with weights 0.2/0.2/0.4/0.2 respectively.• The Markit CDX North America Investment Grade Index is composed of 125 equally weighted credit default swaps on investment grade entities, distributed among 6 sub-indices: High Volatility, Consumer, Energy, Financial, Industrial, and Technology, Media & Tele-communications. Markit CDX indices roll every 6 months in March & September. • The Markit CDX North America High Yield Index is composed of 100 non-investment grade entities, distributed among 2 sub-indices: B, BB. All entities are domiciled in North America. Markit CDX indices roll every 6 months in March & September. • The U.S. Dollar Index (USDX) indicates the general international value of the USD. The USDX does this by averaging the exchange rates between the USD and major world currencies. Intercontinental Exchange (ICE) US computes this by using the rates supplied by some 500 banks.
Investing involves certain risks, including possible loss of principal. You should understand and carefully consider a strategy’s objectives, risks, fees, expenses, and other information before investing. The views expressed in this commentary are subject to change and are not intended to be a recommendation or investment advice. Such views do not take into account the individual financial circumstances or objectives of any investor that receives them. All indices are unmanaged and are not available for direct investment. Indices do not incur costs including the payment of transaction costs, fees, and other expenses. This information should not be considered a solicitation or an offer to provide any service in any jurisdiction where it would be unlawful to do so under the laws of that jurisdiction. Past performance is no guarantee of future results.
© 2021 SWBC. All rights reserved. Securities offered through SWBC Investment Services, LLC, a registered broker/dealer. Member FINRA & SIPC. Advisory services offered through SWBC Investment Company, a Registered Investment Advisor, registered as such with the US Securities & Exchange Commission. SWBC Investment Services, LLC is under separate ownership from any other named entity. SWBC Investment Services, LLC a division of SWBC, is a nationwide partnership of advisor.

Let Us Know What You Thought about this Post.
Put your Comment Below.