
Strait Ahead? Or are the Paths for Oil and Markets Still Erratic? The Strait of Hormuz has effectively reopened, with energy shipments once again moving through one of the world's most critical trade ...
Capital Markets
|
4 min read
This past week, rates largely chopped around in a range with a modest upward bias. Most notably, a poor 5-year Treasury auction with a two bp tail suggested that increased Treasury supply with low investor demand may offer some insight toward future price action – more on that later. Prior resistance for 10-Year Treasury yields at 4.10% proved to be supported this week, as the upper end of the range tested 4.20%.
Municipals followed the Treasuries' lead, demonstrating a slightly weaker tone with marginally higher yields by week's end. Ratios as a percentage of Treasuries finally moved upwards from the costly sub-60% levels on the front end and belly of the curve that had persisted throughout January. Thus, I would characterize the relative value of municipals as “slightly more attractive than before,” but by no means are they cheap. The average ratio for 10-Year AAA municipals over the past 1-Year and 3-Year horizons was 67% and 73%, respectively (see chart below). Therefore, a move off the lows is modestly constructive. However, by remaining well below recent averages, ratios fail to offer strong incentives to pull investors into the market meaningfully.
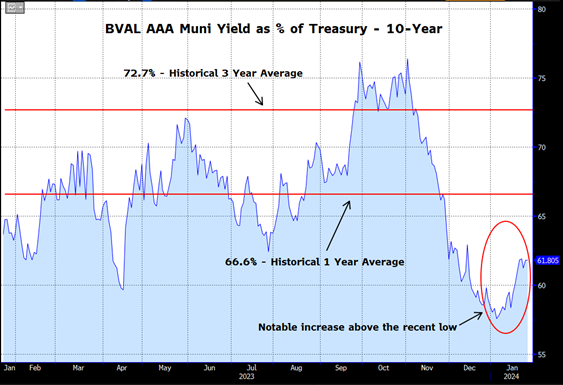
Source: Bloomberg
Observations about the buying behavior of the SWBC client base over the past week focused on the new issue market, with some non-plain vanilla credits coming to market offering the chance for diversification in some specialty state names. Secondary interest was heavily focused on the front end of the curve, including very short-call structured paper. Unsurprisingly, given how flat it is, the intermediate portion of the curve (4 – 10 years) received minimal attention. Inquiry for slightly longer structures where the steep curve offers good value has been robust. However, it remains difficult to source paper in this range.
This week, with a Fed meeting, critical economic data, and the announcement regarding the size of the 10-year and 30-year auctions, the market will look for clues to determine its next move. If the auction sizes are increased appreciably, we could see some weakness in rates as investors demonstrated in last week’s 5-Year auction. Technical factors remain skewed toward the possibility of pushing rates slightly higher. A March rate cut by the Fed is currently expected with around a 50% probability, a far cry from the nearly 100% probability priced by the market only a few weeks ago. We continue to look for opportunities to identify the types of paper most attractive to our customer base and source bonds accordingly.

Definitions:
An index is unmanaged and not available for direct investment. Definitions sourced from Bloomberg.
The Bloomberg Barclays Global Aggregate Negative Yielding Debt Market Value Index represents the portion of the Bloomberg Barclays Global Aggregate Index that measures the aggregate value of global debt with a negative yield. • The S&P 500® is widely regarded as the best single gauge of large-cap U.S. equities and serves as the foundation for a wide range of investment products. The index includes 500 leading companies and captures approximately 80% coverage of available market capitalization. • The NASDAQ Composite Index is a broad-based capitalization-weighted index of stocks in all three NASDAQ tiers: Global Select, Global Market and Capital Market. The index was developed with a base level of 100 as of February 5, 1971.• The Cboe Volatility Index® (VIX) is a calculation designed to produce a measure of constant, 30-day expected volatility of the US stock market, derived from real-time, mid-quote prices of weekly S&P 500® Index (SPX) call and put options with a range of 23 to 37 days to expiration.• The ICE BofA MOVE Index is a yield curve weighted index of the normalized implied volatility on 1-month Treasury options. It is the weighted average of implied volatilities on the CT2 (Current 2 Year Government Note), CT5 (Current 5 Year Government Note), CT10 (Current 10 Year Government Note), and CT30 (Current 30 Year Government Note), with weights 0.2/0.2/0.4/0.2 respectively.• The Markit CDX North America Investment Grade Index is composed of 125 equally weighted credit default swaps on investment grade entities, distributed among 6 sub-indices: High Volatility, Consumer, Energy, Financial, Industrial, and Technology, Media & Tele-communications. Markit CDX indices roll every 6 months in March & September. • The Markit CDX North America High Yield Index is composed of 100 non-investment grade entities, distributed among 2 sub-indices: B, BB. All entities are domiciled in North America. Markit CDX indices roll every 6 months in March & September. • The U.S. Dollar Index (USDX) indicates the general international value of the USD. The USDX does this by averaging the exchange rates between the USD and major world currencies. Intercontinental Exchange (ICE) US computes this by using the rates supplied by some 500 banks.
Investing involves certain risks, including possible loss of principal. You should understand and carefully consider a strategy’s objectives, risks, fees, expenses, and other information before investing. The views expressed in this commentary are subject to change and are not intended to be a recommendation or investment advice. Such views do not take into account the individual financial circumstances or objectives of any investor that receives them. All indices are unmanaged and are not available for direct investment. Indices do not incur costs including the payment of transaction costs, fees, and other expenses. This information should not be considered a solicitation or an offer to provide any service in any jurisdiction where it would be unlawful to do so under the laws of that jurisdiction. Past performance is no guarantee of future results.
© 2021 SWBC. All rights reserved. Securities offered through SWBC Investment Services, LLC, a registered broker/dealer. Member FINRA & SIPC. Advisory services offered through SWBC Investment Company, a Registered Investment Advisor, registered as such with the US Securities & Exchange Commission. SWBC Investment Services, LLC is under separate ownership from any other named entity. SWBC Investment Services, LLC a division of SWBC, is a nationwide partnership of advisor.

Let Us Know What You Thought about this Post.
Put your Comment Below.