
Strait Ahead? Or are the Paths for Oil and Markets Still Erratic? The Strait of Hormuz has effectively reopened, with energy shipments once again moving through one of the world's most critical trade ...
From the Municipal Desk (with contributions from Ryan Riffe):
No April Fool’s Prank: Markets Shift from Inflation to Growth as Rates Peak
The week opened with 10‑Year U.S. Treasuries decisively rejecting Friday’s 4.48% yield peak, as a renewed safe‑haven bid emerged. Markets began shifting their focus toward near‑term economic growth concerns rather than the headline inflation risks tied to the recent spike in oil prices. In short, the pendulum has swung away from an increasingly overextended inflation narrative and back toward growth risks.
At the same time, it remains extraordinarily difficult to handicap the next phase of the conflict involving Iran. Statements from President Trump and Iranian officials continue to offer differing - and at times internally conflicting - signals regarding the path forward, occasionally even within a single remark. This lack of clarity further complicates market expectations.
Ahead of Friday’s always‑critical BLS employment report, the Dallas Fed released an analysis that confirmed what many market participants have long suspected: the breakeven rate of payroll job growth is meaningfully lower than in prior cycles, potentially near zero. Immigration dynamics and current policy settings appear to be exerting a material influence on labor market equilibrium, lowering the threshold needed to avoid deterioration.
Naturally, my greatest concern remains the short‑ and long-term impact of escalating geopolitical conflict and potential disruptions to the Strait of Hormuz. According to energy market experts, the price of deliverable physical oil has risen far above quoted futures prices, with estimates approaching $170 per barrel despite futures trading between $100–$119. Given limited global storage capacity, the resulting supply‑chain stress could rival the magnitude of COVID‑era oil disruptions - albeit from the supply side rather than demand. Executives from Chevron and Shell have both indicated that physical dislocations are intensifying, reinforcing concerns that recession risks are rising.
Friday’s labor market data provided some near‑term relief. Nonfarm payrolls rose by 178,000 versus expectations of 65,000, while the unemployment rate printed at 4.3%, slightly better than the 4.4% consensus. However, revisions remain troubling: February payrolls were revised down from an already‑weak ‑92,000 to an even worse ‑133,000. Given this volatility, headline figures must be interpreted cautiously. The six‑month moving average sits near +15,000 jobs, with an unusually wide dispersion ranging from +178,000 to ‑140,000. Importantly, we will maintain our focus on the unemployment rate, specifically, as Chair Powell recently reiterated that the Federal Reserve remains focused primarily on the unemployment rate as a key policy input.
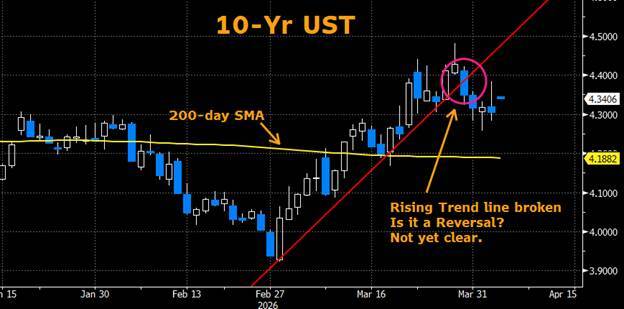
From a rates perspective, my analysis suggests that 10-Year Treasury yields have likely reached a near-term peak. Bullish sentiment is growing that yields may retest lower support levels, particularly around 4.18%, which corresponds to the 200‑day moving average - a level we highlighted as yields accelerated higher in early March. That said, if the prevailing optimism that the conflict will meaningfully de‑escalate within the next two to three weeks proves misplaced, a renewed challenge to the recent 4.48% yield high remains a tangible risk.
From the Municipal Desk (with contributions from Ryan Riffe):
Little by little, the municipal market pieced together its strongest week since late February. The significant drop in rates over the course of the week helped pave the way for all fixed-income assets.
Benchmark yields for municipals fell by as much as 11 basis points, with intermediate and longer maturities seeing the strongest demand. Lipper data showed a return to positive fund flows, marking a reversal from the prior week. Positive fund flows will be crucial for the municipal market to navigate its way through the month as April brings the traditional headwinds of tax season and limited reinvestment capital. Increased market volatility tied to the conflict with Iran has made conditions even more challenging - any help with positive fund flows will be most welcome.
The market looks to price in $9 Billion of new issue supply, which appears lighter than expected. The onslaught of March has positioned municipals favorably as both ratios and absolute yields look attractive. Although we believe volatility will persist, there is evidence of pent-up demand from investors, which was easily observable from client activity this past week.
Weekly Supply @ $9 Billion
2-YR Ratio @ 62%
3-YR Ratio @ 63%
5-YR Ratio @ 66%
10-YR Ratio @ 71%
30-YR Ratio @ 90%

An index is unmanaged and not available for direct investment. Definitions sourced from Bloomberg.
The Bloomberg Barclays Global Aggregate Negative Yielding Debt Market Value Index represents the portion of the Bloomberg Barclays Global Aggregate Index that measures the aggregate value of global debt with a negative yield. • The S&P 500® is widely regarded as the best single gauge of large-cap U.S. equities and serves as the foundation for a wide range of investment products. The index includes 500 leading companies and captures approximately 80% coverage of available market capitalization. • The NASDAQ Composite Index is a broad-based capitalization-weighted index of stocks in all three NASDAQ tiers: Global Select, Global Market and Capital Market. The index was developed with a base level of 100 as of February 5, 1971.• The Cboe Volatility Index® (VIX) is a calculation designed to produce a measure of constant, 30-day expected volatility of the US stock market, derived from real-time, mid-quote prices of weekly S&P 500® Index (SPX) call and put options with a range of 23 to 37 days to expiration.• The ICE BofA MOVE Index is a yield curve weighted index of the normalized implied volatility on 1-month Treasury options. It is the weighted average of implied volatilities on the CT2 (Current 2 Year Government Note), CT5 (Current 5 Year Government Note), CT10 (Current 10 Year Government Note), and CT30 (Current 30 Year Government Note), with weights 0.2/0.2/0.4/0.2 respectively.• The Markit CDX North America Investment Grade Index is composed of 125 equally weighted credit default swaps on investment grade entities, distributed among 6 sub-indices: High Volatility, Consumer, Energy, Financial, Industrial, and Technology, Media & Tele-communications. Markit CDX indices roll every 6 months in March & September. • The Markit CDX North America High Yield Index is composed of 100 non-investment grade entities, distributed among 2 sub-indices: B, BB. All entities are domiciled in North America. Markit CDX indices roll every 6 months in March & September. • The U.S. Dollar Index (USDX) indicates the general international value of the USD. The USDX does this by averaging the exchange rates between the USD and major world currencies. Intercontinental Exchange (ICE) US computes this by using the rates supplied by some 500 banks.
Investing involves certain risks, including possible loss of principal. You should understand and carefully consider a strategy’s objectives, risks, fees, expenses, and other information before investing. The views expressed in this commentary are subject to change and are not intended to be a recommendation or investment advice. Such views do not take into account the individual financial circumstances or objectives of any investor that receives them. All indices are unmanaged and are not available for direct investment. Indices do not incur costs including the payment of transaction costs, fees, and other expenses. This information should not be considered a solicitation or an offer to provide any service in any jurisdiction where it would be unlawful to do so under the laws of that jurisdiction. Past performance is no guarantee of future results.
© 2025 SWBC. All rights reserved. Securities offered through SWBC Investment Services, LLC, a registered broker/dealer. Member FINRA & SIPC. Advisory services offered through SWBC Investment Company, a Registered Investment Advisor, registered as such with the US Securities & Exchange Commission. SWBC Investment Services, LLC is under separate ownership from any other named entity. SWBC Investment Services, LLC a division of SWBC, is a nationwide partnership of advisor.

Let Us Know What You Thought about this Post.
Put your Comment Below.